 1
 2
 3
 4
 5
 6
 7
 8
 9
10
11
12
13
14
15
16
17
18
19
20
21
22
23
24
25
26
27
28
29
30
31
32
33
34
35
36
37
38
39
40
41
42
43
44
45
46
|
#!/usr/bin/env python3
"""
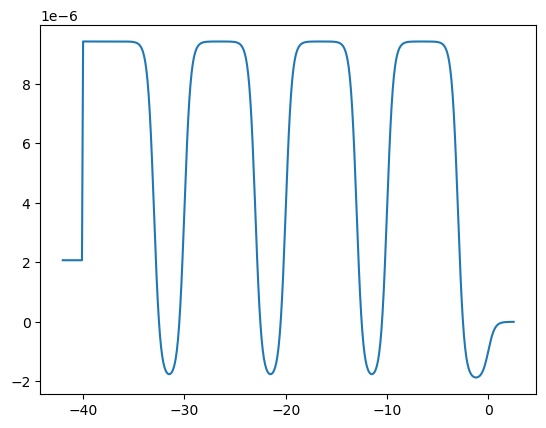
Plot an SLD profile for a multilayer sample with rough interfaces.
"""
import bornagain as ba
from bornagain import angstrom, ba_plot as bp, sample_tools
import numpy as np
import matplotlib.pyplot as plt
def get_sample():
# materials
m_ambient = ba.MaterialBySLD("Ambient", 0, 0)
m_ti = ba.MaterialBySLD("Ti", -1.9493e-06, 0)
m_ni = ba.MaterialBySLD("Ni", 9.4245e-06, 0)
m_substrate = ba.MaterialBySLD("SiSubstrate", 2.0704e-06, 0)
# layers
ambient_layer = ba.Layer(m_ambient)
ti_layer = ba.Layer(m_ti, 30*angstrom)
ni_layer = ba.Layer(m_ni, 70*angstrom)
substrate_layer = ba.Layer(m_substrate)
# sample
sample = ba.MultiLayer()
sample.addLayer(ambient_layer)
roughness = ba.LayerRoughness(5*angstrom, 0.5, 10*angstrom)
for _ in range(4):
sample.addLayerWithTopRoughness(ti_layer, roughness)
sample.addLayerWithTopRoughness(ni_layer, roughness)
sample.addLayer(substrate_layer)
return sample
if __name__ == '__main__':
bp.parse_args()
sample = get_sample()
zpoints, slds = sample_tools.materialProfile(sample, 400)
plt.figure()
plt.plot(zpoints, np.real(slds))
bp.show_or_export()
|