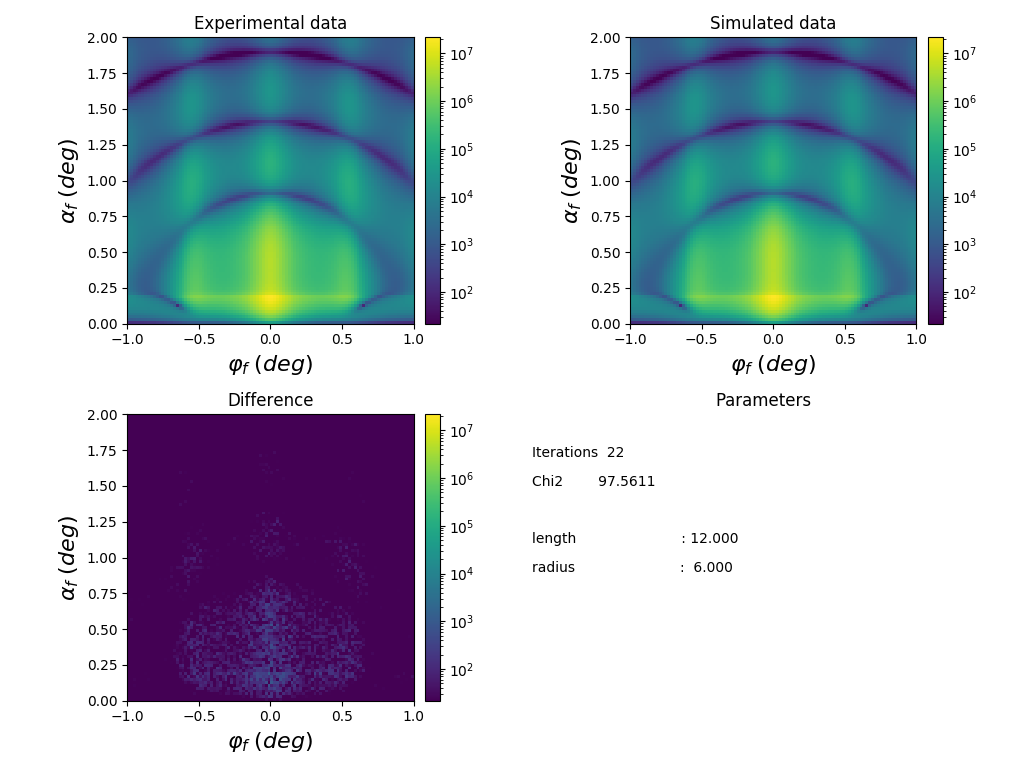
  1
  2
  3
  4
  5
  6
  7
  8
  9
 10
 11
 12
 13
 14
 15
 16
 17
 18
 19
 20
 21
 22
 23
 24
 25
 26
 27
 28
 29
 30
 31
 32
 33
 34
 35
 36
 37
 38
 39
 40
 41
 42
 43
 44
 45
 46
 47
 48
 49
 50
 51
 52
 53
 54
 55
 56
 57
 58
 59
 60
 61
 62
 63
 64
 65
 66
 67
 68
 69
 70
 71
 72
 73
 74
 75
 76
 77
 78
 79
 80
 81
 82
 83
 84
 85
 86
 87
 88
 89
 90
 91
 92
 93
 94
 95
 96
 97
 98
 99
100
101
102
103
104
105
106
107
108
109
110
111
112
113
114
115
116
117
|
#!/usr/bin/env python3
"""
External minimize: using lmfit minimizers for BornAgain fits.
Fit progress is plotted using lmfit iteration calbback function.
"""
import numpy as np
from matplotlib import pyplot as plt
import bornagain as ba
from bornagain import deg, angstrom, nm
import lmfit


def get_sample(params):
    """
    Returns a sample with cylinders and pyramids on a substrate,
    forming a hexagonal lattice.
    """
    radius = params['radius']
    lattice_length = params['length']

    m_vacuum = ba.HomogeneousMaterial("Vacuum", 0, 0)
    m_substrate = ba.HomogeneousMaterial("Substrate", 6e-6, 2e-8)
    m_particle = ba.HomogeneousMaterial("Particle", 6e-4, 2e-8)

    sphere_ff = ba.FormFactorFullSphere(radius)
    sphere = ba.Particle(m_particle, sphere_ff)
    particle_layout = ba.ParticleLayout()
    particle_layout.addParticle(sphere)

    interference = ba.InterferenceFunction2DLattice(
        ba.HexagonalLattice2D(lattice_length, 0))
    pdf = ba.FTDecayFunction2DCauchy(10*nm, 10*nm, 0)
    interference.setDecayFunction(pdf)

    particle_layout.setInterferenceFunction(interference)

    vacuum_layer = ba.Layer(m_vacuum)
    vacuum_layer.addLayout(particle_layout)
    substrate_layer = ba.Layer(m_substrate, 0)
    multi_layer = ba.MultiLayer()
    multi_layer.addLayer(vacuum_layer)
    multi_layer.addLayer(substrate_layer)
    return multi_layer


def get_simulation(params):
    """
    Create and return GISAXS simulation with beam and detector defined
    """
    simulation = ba.GISASSimulation()
    simulation.setDetectorParameters(100, -1*deg, 1*deg, 100, 0, 2*deg)
    simulation.setBeamParameters(1*angstrom, 0.2*deg, 0)
    simulation.beam().setIntensity(1e+08)
    simulation.setSample(get_sample(params))
    return simulation


def create_real_data():
    """
    Generating "real" data by adding noise to the simulated data.
    """
    params = {'radius': 6*nm, 'length': 12*nm}
    simulation = get_simulation(params)
    simulation.runSimulation()

    # retrieving simulated data in the form of numpy array
    real_data = simulation.result().array()

    # spoiling simulated data with noise to produce "real" data
    np.random.seed(0)
    noise_factor = 0.1
    noisy = np.random.normal(real_data, noise_factor*np.sqrt(real_data))
    noisy[noisy < 0.1] = 0.1
    return noisy


class LMFITPlotter:
    """
    Adapts standard plotter for lmfit minimizer.
    """
    def __init__(self, fit_objective, every_nth=10):
        self.fit_objective = fit_objective
        self.plotter_gisas = ba_fitmonitor.PlotterGISAS()
        self.every_nth = every_nth

    def __call__(self, params, iter, resid):
        if iter % self.every_nth == 0:
            self.plotter_gisas.plot(self.fit_objective)


def run_fitting():
    """
    main function to run fitting
    """
    real_data = create_real_data()

    fit_objective = ba.FitObjective()
    fit_objective.addSimulationAndData(get_simulation, real_data, 1)
    fit_objective.initPrint(10)

    params = lmfit.Parameters()
    params.add('radius', value=7*nm, min=5*nm, max=8*nm)
    params.add('length', value=10*nm, min=8*nm, max=14*nm)

    plotter = LMFITPlotter(fit_objective)
    result = lmfit.minimize(fit_objective.evaluate_residuals,
                            params,
                            iter_cb=plotter)
    fit_objective.finalize(result)

    result.params.pretty_print()
    print(lmfit.fit_report(result))


if __name__ == '__main__':
    run_fitting()
    plt.show()
|
 BornAgain
≻ 1.19
≻ Documentation ≻ Python scripting ≻ Fitting ≻ Extended examples ≻ External minimizer: plotting
