  1
  2
  3
  4
  5
  6
  7
  8
  9
 10
 11
 12
 13
 14
 15
 16
 17
 18
 19
 20
 21
 22
 23
 24
 25
 26
 27
 28
 29
 30
 31
 32
 33
 34
 35
 36
 37
 38
 39
 40
 41
 42
 43
 44
 45
 46
 47
 48
 49
 50
 51
 52
 53
 54
 55
 56
 57
 58
 59
 60
 61
 62
 63
 64
 65
 66
 67
 68
 69
 70
 71
 72
 73
 74
 75
 76
 77
 78
 79
 80
 81
 82
 83
 84
 85
 86
 87
 88
 89
 90
 91
 92
 93
 94
 95
 96
 97
 98
 99
100
101
102
103
104
105
106
107
108
109
110
111
112
113
114
115
116
117
|
#!/usr/bin/env python3
"""
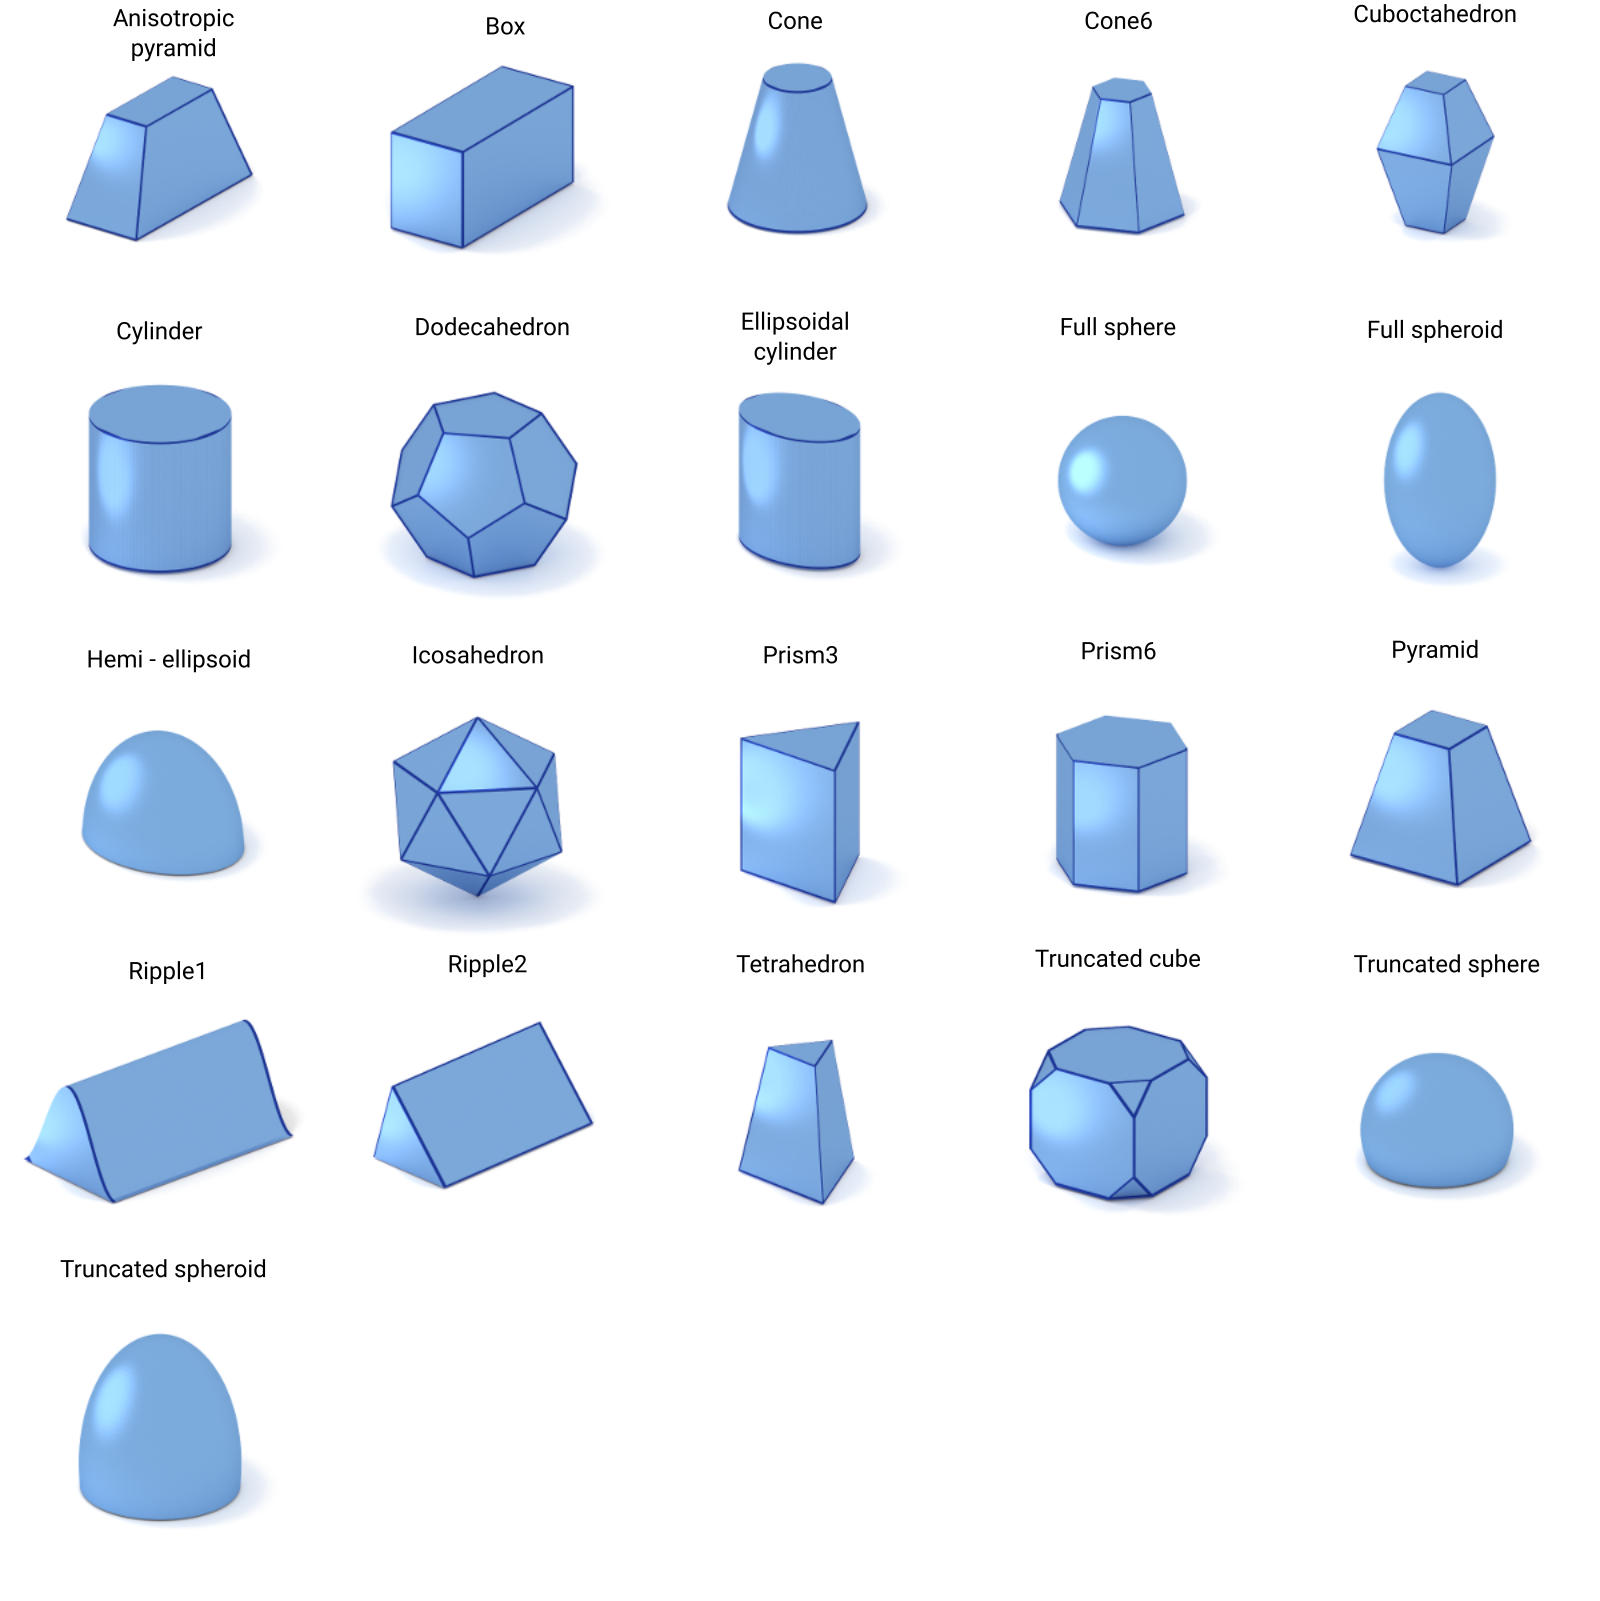
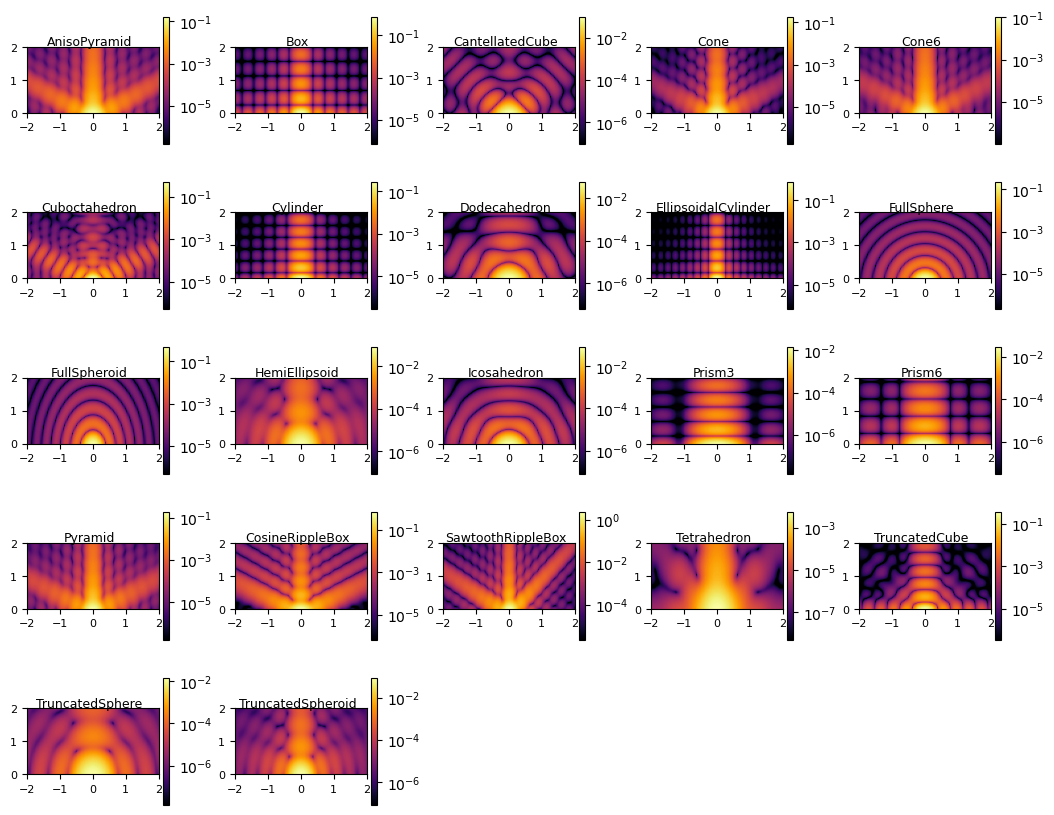
All form factors available in BornAgain in the Born Approximation
"""
import numpy
import bornagain as ba
import ba_plot
from bornagain import deg, angstrom
from matplotlib import pyplot as plt
phi_min, phi_max = -2, 2.0
alpha_min, alpha_max = 0, 2.0
formfactors = [
ba.FormFactorAnisoPyramid(20, 16, 13, 60*deg),
ba.FormFactorBox(20, 16, 13),
ba.FormFactorCantellatedCube(15, 6),
ba.FormFactorCone(10, 13, 60*deg),
ba.FormFactorCone6(10, 13, 60*deg),
ba.FormFactorCuboctahedron(20, 13, 0.7, 60*deg),
ba.FormFactorCylinder(8, 16),
ba.FormFactorDodecahedron(5),
ba.FormFactorEllipsoidalCylinder(8, 13, 16),
ba.FormFactorFullSphere(8),
ba.FormFactorFullSpheroid(10, 13),
ba.FormFactorHemiEllipsoid(10, 6, 8),
ba.FormFactorIcosahedron(8),
ba.FormFactorPrism3(10, 13),
ba.FormFactorPrism6(5, 11),
ba.FormFactorPyramid(18, 13, 60*deg),
ba.FormFactorCosineRippleBox(27, 20, 14),
ba.FormFactorSawtoothRippleBox(36, 25, 14, 3),
ba.FormFactorTetrahedron(15, 6, 60*deg),
ba.FormFactorTruncatedCube(15, 6),
ba.FormFactorTruncatedSphere(5, 7, 0),
ba.FormFactorTruncatedSpheroid(7.5, 9, 1.2, 0),
]
def get_sample(formfactor):
"""
Returns a one-layer sample that contains particles with given form factor.
"""
# defining materials
m_vacuum = ba.HomogeneousMaterial("Vacuum", 0, 0)
m_particle = ba.HomogeneousMaterial("Particle", 6e-4, 2e-8)
# collection of particles
particle = ba.Particle(m_particle, formfactor)
particle_layout = ba.ParticleLayout()
particle_layout.addParticle(particle)
vacuum_layer = ba.Layer(m_vacuum)
vacuum_layer.addLayout(particle_layout)
multi_layer = ba.MultiLayer()
multi_layer.addLayer(vacuum_layer)
return multi_layer
def get_simulation(sample):
"""
Returns GISAXS simulation with standard beam and detector.
"""
simulation = ba.GISASSimulation()
simulation.setDetectorParameters(100, phi_min*deg, phi_max*deg, 100,
alpha_min*deg, alpha_max*deg)
simulation.setBeamParameters(1*angstrom, 0.2*deg, 0)
simulation.setSample(sample)
return simulation
def simulate(ff):
"""
Runs simulation for one form factor, and returns simulated intensity pattern
"""
sample = get_sample(ff)
simulation = get_simulation(sample)
simulation.runSimulation()
return simulation.result()
def simulate_and_plot():
"""
Run simulation one by one for every form factor from the list and plot results
on a single canvas
"""
fig = plt.figure(figsize=(12.80, 10.24))
for nplot, ff in enumerate(formfactors):
name = ff.__class__.__name__
name = name.replace("FormFactor", "")
print("Generating intensity map in BA for '{0}'".format(name))
result = simulate(ff)
# showing the result
plt.subplot(5, 5, nplot + 1)
plt.subplots_adjust(wspace=0.3, hspace=0.3)
ba_plot.plot_colormap(result, xlabel="", ylabel="", zlabel="")
plt.tick_params(axis='both', which='major', labelsize=8)
plt.tick_params(axis='both', which='minor', labelsize=6)
plt.xticks(numpy.arange(phi_min, phi_max + 0.0001, 1))
plt.text(-0.1,
2.15,
name,
horizontalalignment='center',
verticalalignment='center',
fontsize=9)
plt.show()
if __name__ == '__main__':
simulate_and_plot()
|