Plotting the sample profile

This short tutorial demonstrates how to visualize the Scattering Length Density (SLD) profile of a Multilayer sample. For more details about preparing a sample and carrying on a reflectometry simulated experiment, read the reflectometry simulation tutorial.

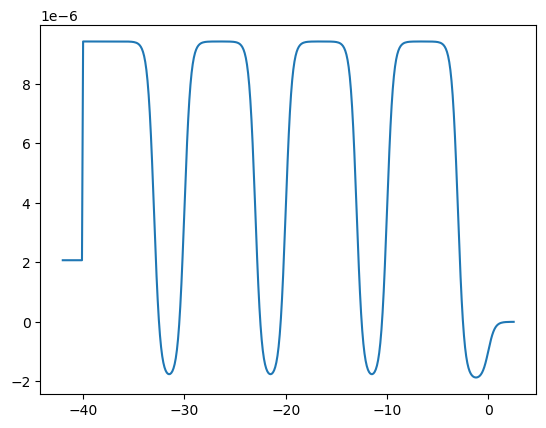
This figure shows the sld profile of the sample built, i.e. the sld value ($y$ axis) as a function of depth ($x$ axis). $x = 0$ represents the surface of the sample, while the substrate is located at $x = -40 \, [{\rm nm}]$ in this example.

To obtain the figure above, one must run the script below, which is basically about defining a sample with interfacial roughness and plotting right away its sld profile.

 1
 2
 3
 4
 5
 6
 7
 8
 9
10
11
12
13
14
15
16
17
18
19
20
21
22
23
24
25
26
27
28
29
30
31
32
33
34
35
36
37
38
39
40
41
42
43
44
45
46
47
48
49
#!/usr/bin/env python3
"""
Basic example for producing a profile of SLD of a multilayer.
"""

import bornagain as ba
from bornagain import deg, angstrom, nm
import numpy as np
import matplotlib.pyplot as plt


def get_sample():
    """
    Defines sample and returns it
    """

    # creating materials
    m_ambient = ba.MaterialBySLD("Ambient", 0, 0)
    m_ti = ba.MaterialBySLD("Ti", -1.9493e-06, 0)
    m_ni = ba.MaterialBySLD("Ni", 9.4245e-06, 0)
    m_substrate = ba.MaterialBySLD("SiSubstrate", 2.0704e-06, 0)

    # creating layers
    ambient_layer = ba.Layer(m_ambient)
    ti_layer = ba.Layer(m_ti, 30*angstrom)
    ni_layer = ba.Layer(m_ni, 70*angstrom)
    substrate_layer = ba.Layer(m_substrate)

    # create roughness
    roughness = ba.LayerRoughness(5*angstrom, 0.5, 10*angstrom)

    # creating multilayer
    multi_layer = ba.MultiLayer()
    multi_layer.addLayer(ambient_layer)
    for i in range(4):
        multi_layer.addLayerWithTopRoughness(ti_layer, roughness)
        multi_layer.addLayerWithTopRoughness(ni_layer, roughness)
    multi_layer.addLayer(substrate_layer)

    return multi_layer


if __name__ == '__main__':
    sample = get_sample()
    zpoints, slds = ba.materialProfile(sample)

    plt.figure()
    plt.plot(zpoints, np.real(slds))
    plt.show()
MaterialProfile.py