Plotting the Scattering Length Density (SLD) profile of a sample which contains embedded particles, will produce a figure similar to the one below. To embedd particles on a sample, a 2D square lattice particle layout needs to be created.
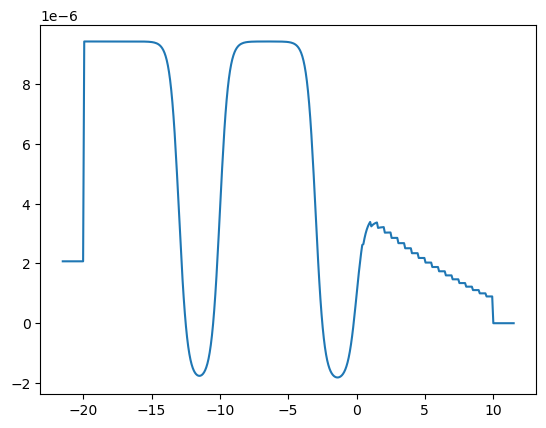
This figure shows the SLD profile of the sample built, i.e. the SLD value ($y$ axis) as a function of $z$, the depth of the sample ($x$ axis). $z = 0$ represents the surface of the sample, while the substrate is located at $x = −40$[nm] in this example. Notice the stairlike structure that forms for positive $z$ values, $0 < z < 10$, due to the presence o the embedded cone particles.
In the figure above, the embeded cone particles in the top layer create a stairlike SLD profile in the region $0 < z < 10$. Each step of the stairlike profile is a weighted average between the SLD of the particle material and that of the solvent (air in this case).
To refine the number of steps obtained in the plot above (and for the calculations carried on in an eventual simulation), the number of slices needs to be set (In the present example, it is set to 20: ambient_layer.setNumberOfSlices(20)).
|
|