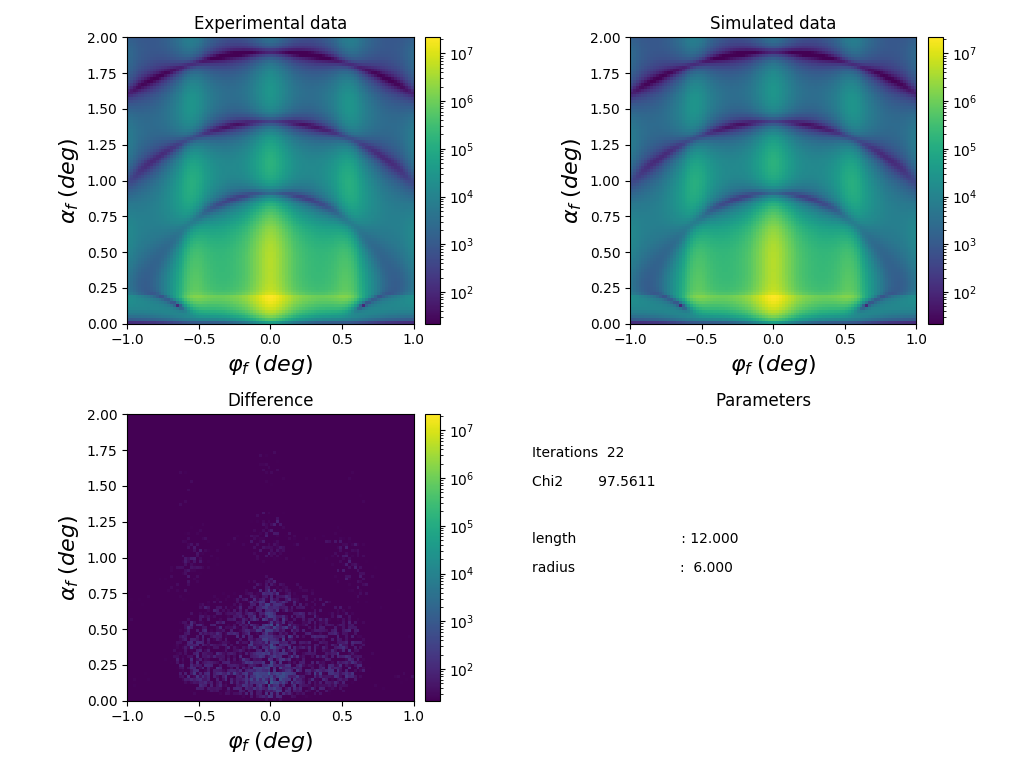
1
 2
 3
 4
 5
 6
 7
 8
 9
10
11
12
13
14
15
16
17
18
19
20
21
22
23
24
25
26
27
28
29
30
31
32
33
34
35
36
37
38
39
40
41
42
43
44
45
46
47
48
49
50
51
52
53
54
55
56
57
58
59
60
61
62
63
64
65
66
67
68
69
70
71
72
73
74
75
76
77
78
79
80
81
82
83
84
85
86
87
88
89
90
91
92
93
94
95
96
|
#!/usr/bin/env python3
"""
External minimize: using lmfit minimizers for BornAgain fits.
Fit progress is plotted using lmfit iteration callback function.
"""
import bornagain as ba
from bornagain import ba_fitmonitor, deg, nm
import lmfit
import numpy as np


def get_sample(P):
    """
    Spheres on a hexagonal lattice, parameterized for fitting.
    """
    substrate_mat = ba.RefractiveMaterial(
        "Substrate", (0.28, 0.57, 0.82), 6e-6, 2e-8)
    particle_mat = ba.RefractiveMaterial(
        "Particle", (0.86, 0.24, 0.18), 6e-4, 2e-8)
    particle = ba.Particle(particle_mat, ba.Sphere(P["radius"]))

    layout = ba.Crystal2D(
        particle, ba.HexagonalLattice2D(P["length"], 0))
    layout.setDecayFunction(ba.Profile2DCauchy(100*nm, 100*nm, 0))

    particle_layer = ba.Layer(ba.Vacuum())
    particle_layer.deposit2D(layout)

    sample = ba.Sample()
    sample.addLayer(particle_layer)
    sample.addLayer(ba.Layer(substrate_mat))
    return sample


def get_simulation(P):
    """
    GISAS simulation for the parameterized hexagonal lattice.
    """
    n = 100
    beam = ba.Beam(1e8, 0.1*nm, 0.2*deg)
    detector = ba.SphericalDetector(n, -1*deg, 1*deg, n, 0, 2*deg)
    simulation = ba.ScatteringSimulation(beam, get_sample(P), detector)
    simulation.options().setUseAvgMaterials(False)
    return simulation


def fake_data():
    """
    Noisy synthetic data for a known hexagonal lattice.
    """
    P = {"radius": 6*nm, "length": 12*nm}
    return get_simulation(P).simulate().noisy(0.1, 0.1)


sim_result = None  # latest simulation, shared with the plot callback


class LMFITPlotter:
    """
    Adapts standard plotter for lmfit minimizer.
    """

    def __init__(self, exp_data, every_nth=10):
        self.exp_data = exp_data
        self.plotter_gisas = ba_fitmonitor.PlotterGISAS()
        self.every_nth = every_nth

    def __call__(self, P, i, resid):
        if i % self.every_nth == 0 and sim_result is not None:
            chi2 = float(np.sum(resid*resid))
            self.plotter_gisas.plot(self.exp_data, sim_result, P, chi2)


if __name__ == '__main__':
    data = fake_data()
    flat_exp_values = data.intensities().ravel()

    def residuals(P):
        """
        Runs a simulation for given parameters P, and returns residuals
        vector.
        """
        global sim_result
        sim_result = get_simulation(P.valuesdict()).simulate()
        flat_sim_values = sim_result.intensities().ravel()
        return flat_exp_values - flat_sim_values

    P = lmfit.Parameters()
    P.add('radius', value=7*nm, min=5*nm, max=8*nm)
    P.add('length', value=10*nm, min=8*nm, max=14*nm)
    plotter = LMFITPlotter(data)
    result = lmfit.minimize(residuals, P, iter_cb=plotter)
    result.params.pretty_print()
    print(lmfit.fit_report(result))
    finalP = result.params.valuesdict()
    ba.showSample3D(get_sample(finalP), sample_size=300*nm, seed=0)
|