1
2
3
4
5
6
7
8
9
10
11
12
13
14
15
16
17
18
19
20
21
22
23
24
25
26
27
28
29
30
31
32
33
34
35
36
37
38
39
40
41
42
43
44
45
46
47
48
49
50
51
52
53
54
55
56
57
58
59
60
61
62
63
64
|
#!/usr/bin/env python3
# /// script
# requires-python = ">=3.10"
# dependencies = ["bornagain>=25,<26"]
# ///
"""
An example of defining reflectometry instrument
for time of flight experiment. In this example
we will use purely qz-defined beam,
without explicitly specifying
incident angle or a wavelength.
Additionally we will set pointwise resolution
to the scan.
Note that these approaches work with SLD-based
materials only.
"""
import numpy as np
import bornagain as ba
ba.require_versions("bornagain>=25,<26")
from bornagain import nm
def get_sample():
"""
Twenty alternating Ti and Ni layers on a silicon substrate.
"""
ambient_mat = ba.Vacuum()
ti_mat = ba.SLDMaterial("Ti", (0.05, 0.62, 0.55), -1.9493e-6, 0)
ni_mat = ba.SLDMaterial("Ni", (0.93, 0.48, 0.14), 9.4245e-6, 0)
substrate_mat = ba.SLDMaterial(
"SiSubstrate", (0.28, 0.57, 0.82), 2.0704e-6, 0)
stack = ba.LayerStack(10)
stack.addLayer(ba.Layer(ti_mat, 3*nm))
stack.addLayer(ba.Layer(ni_mat, 7*nm))
sample = ba.Sample()
sample.addLayer(ba.Layer(ambient_mat))
sample.addStack(stack)
sample.addLayer(ba.Layer(substrate_mat))
return sample
def get_simulation(sample):
"Specular simulation with a qz-defined beam"
n = 500
qzs = np.linspace(0.01, 1, n) # qz-values
dq = 0.03*qzs
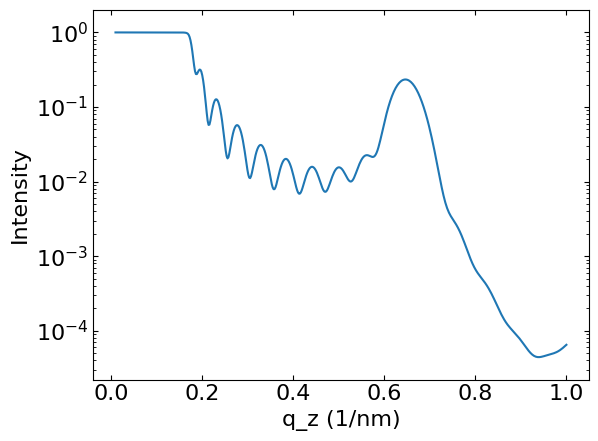
distr = ba.DistributionGaussian(0., 1., 25, 2.)
scan = ba.QzScan(qzs)
scan.setVectorResolution(distr, dq)
return ba.SpecularSimulation(scan, sample)
if __name__ == '__main__':
sample = get_sample()
ba.showSample3D(sample, sample_size=120*nm, seed=0)
simulation = get_simulation(sample)
result = simulation.simulate()
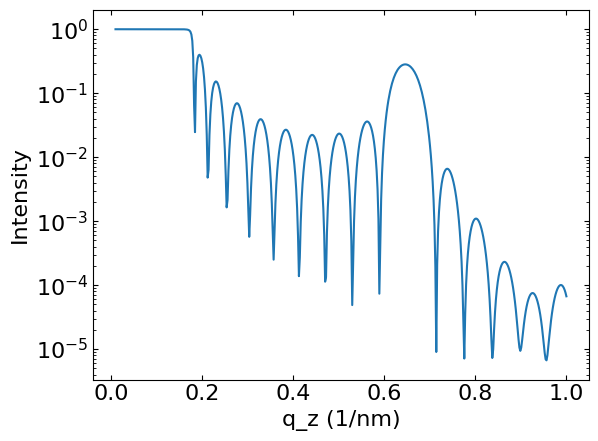
ba.plot_datafield(result)
ba.plt.show()
|