1
  2
  3
  4
  5
  6
  7
  8
  9
 10
 11
 12
 13
 14
 15
 16
 17
 18
 19
 20
 21
 22
 23
 24
 25
 26
 27
 28
 29
 30
 31
 32
 33
 34
 35
 36
 37
 38
 39
 40
 41
 42
 43
 44
 45
 46
 47
 48
 49
 50
 51
 52
 53
 54
 55
 56
 57
 58
 59
 60
 61
 62
 63
 64
 65
 66
 67
 68
 69
 70
 71
 72
 73
 74
 75
 76
 77
 78
 79
 80
 81
 82
 83
 84
 85
 86
 87
 88
 89
 90
 91
 92
 93
 94
 95
 96
 97
 98
 99
100
101
102
103
104
105
106
107
108
109
110
111
112
113
114
115
116
117
118
119
120
121
122
123
124
125
126
127
128
129
130
131
132
133
134
135
136
137
138
139
140
141
142
143
144
145
146
147
148
149
150
151
152
153
154
155
156
157
158
159
160
161
162
163
164
165
166
167
168
169
170
171
172
173
174
175
176
177
178
179
180
181
182
183
184
185
186
187
188
189
190
191
192
193
194
195
196
197
198
199
200
201
202
203
|
#!/usr/bin/env python3
# /// script
# requires-python = ">=3.10"
# dependencies = ["bornagain>=25,<26", "corner", "emcee", "lmfit", "tqdm"]
# ///
"""
Fit Ni and Ti layer thicknesses, then sample their posterior with emcee.

Author: Andrew McCluskey (andrew.mccluskey@ess.eu)
"""

from itertools import count
from pathlib import Path

import bornagain as ba
ba.require_versions("bornagain>=25,<26")
import corner
import emcee
import lmfit
import numpy as np
from bornagain import nm
from matplotlib import gridspec


np.random.seed(1)


def get_sample(ni_thickness, ti_thickness):
    # pure real scattering-length densities (in angstrom^-2)
    si_sld_real = 2.0704e-06  # Si (substrate)
    ni_sld_real = 9.4245e-06  # Ni
    ti_sld_real = -1.9493e-06  # Ti

    # materials
    vacuum = ba.Vacuum()
    ni_color = (0.93, 0.48, 0.14)
    ni_mat = ba.SLDMaterial("Ni", ni_color, ni_sld_real, 0)
    ti_color = (0.05, 0.62, 0.55)
    ti_mat = ba.SLDMaterial("Ti", ti_color, ti_sld_real, 0)
    substrate_color = (0.28, 0.57, 0.82)
    substrate_mat = ba.SLDMaterial("SiSubstrate", substrate_color, si_sld_real, 0)

    # layers
    vacuum_layer = ba.Layer(vacuum)
    ni_layer = ba.Layer(ni_mat, ni_thickness)
    ti_layer = ba.Layer(ti_mat, ti_thickness)
    substrate_layer = ba.Layer(substrate_mat)

    # periodic stack
    n_repetitions = 10
    stack = ba.LayerStack(n_repetitions)
    stack.addLayer(ti_layer)
    stack.addLayer(ni_layer)

    # sample
    sample = ba.Sample()
    sample.addLayer(vacuum_layer)
    sample.addStack(stack)
    sample.addLayer(substrate_layer)

    return sample


def get_simulation(sample, points):
    scan = ba.AlphaScan(ba.ListScan("alpha_i (rad)", points))
    scan.setWavelength(0.154 * nm)
    return ba.SpecularSimulation(scan, sample)


def run_simulation(points, ni_thickness, ti_thickness):
    sample = get_sample(ni_thickness, ti_thickness)
    simulation = get_simulation(sample, points)

    result = simulation.simulate()
    return result.intensities()


def load_data(filename):
    # Data files are next to this script.
    data_dir = Path(__file__).resolve().parent
    filepath = data_dir / filename
    two_alpha, y = ba.read_columns(filepath, usecols=(0, 1))
    q = 0.5*two_alpha*ba.deg
    dy = y * 0.1  # artificial 10% standard uncertainties
    return q, y, dy


def plot_results(q, y, dy, posterior_samples, posterior_mean):
    figure = ba.plt.figure(figsize=(8, 9))
    outer_grid = gridspec.GridSpec(
        2,
        1,
        figure=figure,
        height_ratios=[1.75, 1.1])
    corner_grid = gridspec.GridSpecFromSubplotSpec(
        2,
        4,
        subplot_spec=outer_grid[0],
        width_ratios=[0.1, 1, 1, 0.1])
    for row in range(2):
        for column in range(2):
            figure.add_subplot(corner_grid[row, column + 1])
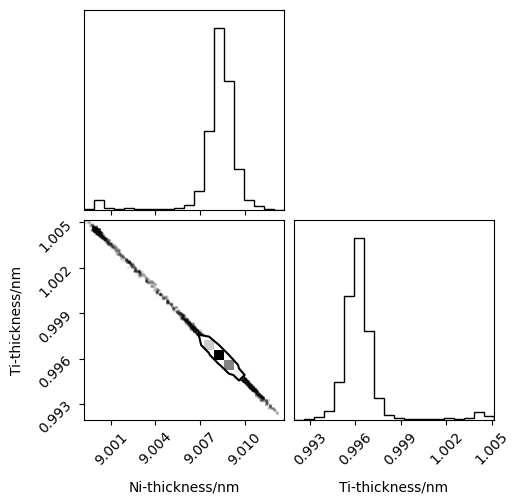
    corner.corner(
        posterior_samples,
        labels=['Ni-thickness/nm', 'Ti-thickness/nm'],
        truths=posterior_mean,
        show_titles=True,
        title_fmt='.5f',
        fig=figure)

    reflectivity_axis = figure.add_subplot(outer_grid[1])
    reflectivity_axis.errorbar(
        q, y, dy, marker='.', ls='', label='Reference data')
    reflectivity_axis.plot(
        q, run_simulation(q, *posterior_mean), '-', label='Posterior mean')
    reflectivity_axis.set_xlabel('$\\alpha$/rad')
    reflectivity_axis.set_ylabel('$R$')
    reflectivity_axis.set_yscale('log')
    reflectivity_axis.set_title('Reflectivity at the posterior mean')
    reflectivity_axis.legend()
    figure.set_layout_engine(
        'compressed', w_pad=0.13, h_pad=0.13, wspace=0.05, hspace=0.08)
    return figure


if __name__ == '__main__':
    q, y, dy = load_data("genx_alternating_layers.dat.gz")

    parameter_bounds = np.array([[6.5*nm, 7.5*nm], [2.5*nm, 3.5*nm]])

    def log_likelihood(P):
        """Return the Gaussian log-likelihood for both thicknesses."""
        y_sim = run_simulation(q, *P)
        sigma2 = dy**2
        return -0.5*np.sum((y - y_sim)**2/sigma2 + np.log(sigma2))

    def log_probability(P):
        inside_bounds = np.all(
            (parameter_bounds[:, 0] <= P)
            & (P <= parameter_bounds[:, 1]))
        return log_likelihood(P) if inside_bounds else -np.inf

    def de_objective(P):
        values = [P["ni_thickness"].value, P["ti_thickness"].value]
        return -log_likelihood(values)

    parameters = lmfit.Parameters()
    parameters.add(
        "ni_thickness", value=7*nm, min=parameter_bounds[0, 0],
        max=parameter_bounds[0, 1])
    parameters.add(
        "ti_thickness", value=3.2*nm, min=parameter_bounds[1, 0],
        max=parameter_bounds[1, 1])
    n_generations = 1000
    generations = count(1)

    def stop_callback(*_args, **_kwargs):
        return next(generations) >= n_generations

    # Each generation uses 15*2 likelihood evaluations; the emergency cap
    # must also cover the initial population and polishing.
    solution = lmfit.minimize(
        de_objective,
        parameters,
        method="differential_evolution",
        callback=stop_callback,  # stops the search after n_generations
        popsize=15,
        max_nfev=100000,  # emergency evaluation cap
        polish=True,
        seed=42)

    best_ni_thickness = solution.params["ni_thickness"].value
    best_ti_thickness = solution.params["ti_thickness"].value
    best_fit = np.array([best_ni_thickness, best_ti_thickness])
    print('MLE Ni Thickness', best_ni_thickness, 'nm')
    print('MLE Ti Thickness', best_ti_thickness, 'nm')

    # Sample the bounded posterior around the maximum-likelihood estimate
    n_walkers = 32
    n_parameters = best_fit.size
    walker_spread = 1e-4
    walker_positions = np.random.normal(
        best_fit, walker_spread, (n_walkers, n_parameters))
    sampler = emcee.EnsembleSampler(
        n_walkers, n_parameters, log_probability)
    sampler.run_mcmc(walker_positions,
                     1000,
                     progress=True)

    # Plot sampled parameters and reflectivity in one figure
    posterior_samples = sampler.get_chain(
        discard=200, flat=True)
    posterior_mean = posterior_samples.mean(axis=0)
    posterior_std = posterior_samples.std(axis=0)
    print('Posterior Ni Thickness', posterior_mean[0], '+/-',
          posterior_std[0], 'nm')
    print('Posterior Ti Thickness', posterior_mean[1], '+/-',
          posterior_std[1], 'nm')
    result_figure = plot_results(q, y, dy, posterior_samples, posterior_mean)
    ba.plt.show()

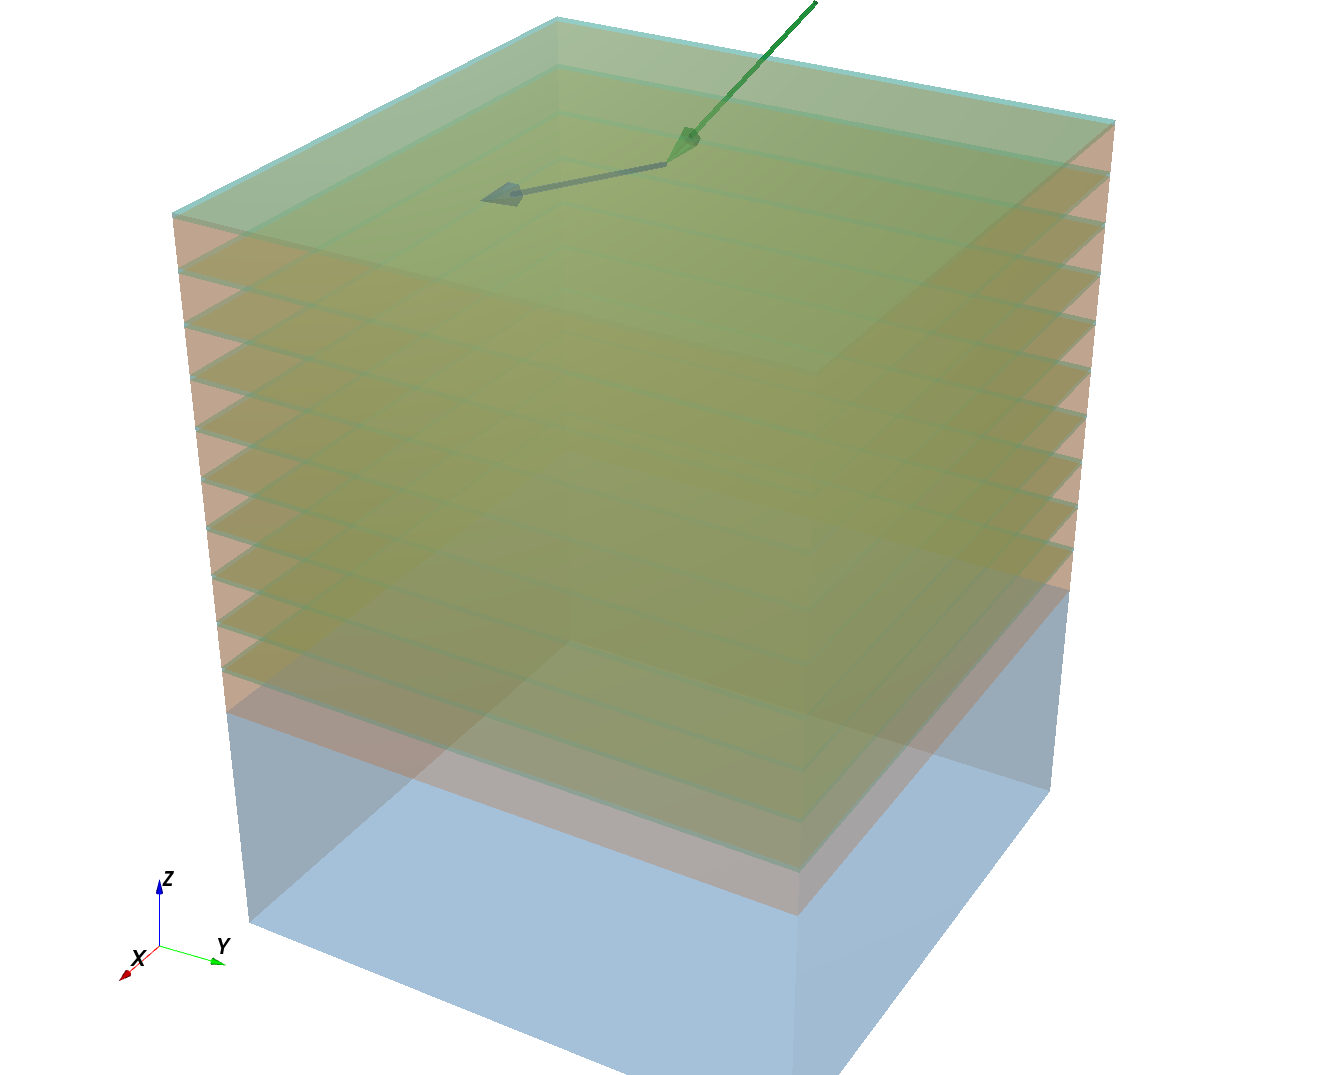
    sample_at_posterior_mean = get_sample(*posterior_mean)
    ba.showSample3D(sample_at_posterior_mean, sample_size=120*nm, seed=0)
|