1
 2
 3
 4
 5
 6
 7
 8
 9
10
11
12
13
14
15
16
17
18
19
20
21
22
23
24
25
26
27
28
29
30
31
32
33
34
35
36
37
38
39
40
41
42
43
44
45
46
47
48
49
50
51
52
53
54
55
56
57
58
59
60
61
62
63
64
65
66
67
68
69
70
71
72
73
74
75
76
77
78
79
80
81
82
83
84
85
86
87
88
89
90
91
92
93
94
95
96
97
|
#!/usr/bin/env python3
# /// script
# requires-python = ">=3.10"
# dependencies = ["bornagain>=25,<26"]
# ///
"""
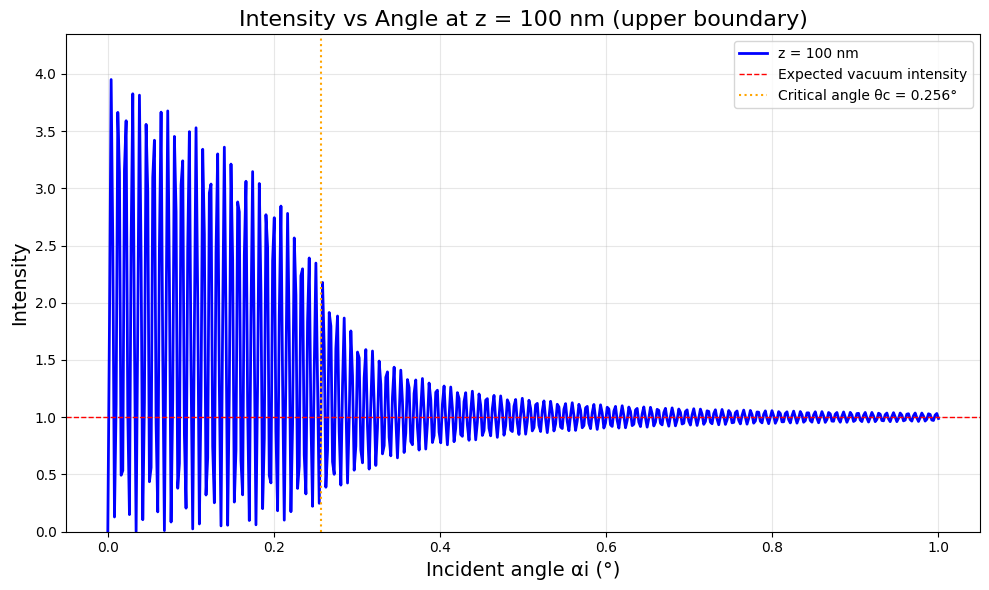
Intensity vs angle at fixed depth z=100nm (upper vacuum boundary).
"""
import bornagain as ba
ba.require_versions("bornagain>=25,<26")
from bornagain import deg, nm

#  beam data
ai_min = 0*deg
ai_max = 1*deg
wl = 0.03*nm  # wavelength

#  fixed depth at upper boundary
z_fixed = 100*nm


def get_sample():
    # Define materials
    vac_color = (0.90, 0.93, 0.97)
    vac_mat = ba.RefractiveMaterial("Vac", vac_color, 0, 0)
    a_color = (0.05, 0.62, 0.55)
    a_mat = ba.RefractiveMaterial("A", a_color, 1e-5, 3e-6)

    # Define layers
    layer_top = ba.Layer(vac_mat)
    layer_1 = ba.Layer(a_mat, 300*nm)
    layer_bot = ba.Layer(vac_mat)

    # Define sample
    sample = ba.Sample()
    sample.addLayer(layer_top)
    sample.addLayer(layer_1)
    sample.addLayer(layer_bot)

    return sample


def get_simulation(sample):
    """
    Returns a depth-probe simulation scanning over angles at fixed depth.
    """
    nz = 1  # Single depth point
    na = 500

    scan = ba.AlphaScan(na, ai_min, ai_max)
    scan.setWavelength(wl)
    footprint = ba.FootprintSquare(0.01)
    scan.setFootprint(footprint)

    z_axis = ba.EquiDivision("z (nm)", nz, z_fixed, z_fixed)
    simulation = ba.DepthprobeSimulation(scan, sample, z_axis)

    return simulation


if __name__ == '__main__':
    sample = get_sample()
    simulation = get_simulation(sample)
    result = simulation.simulate()
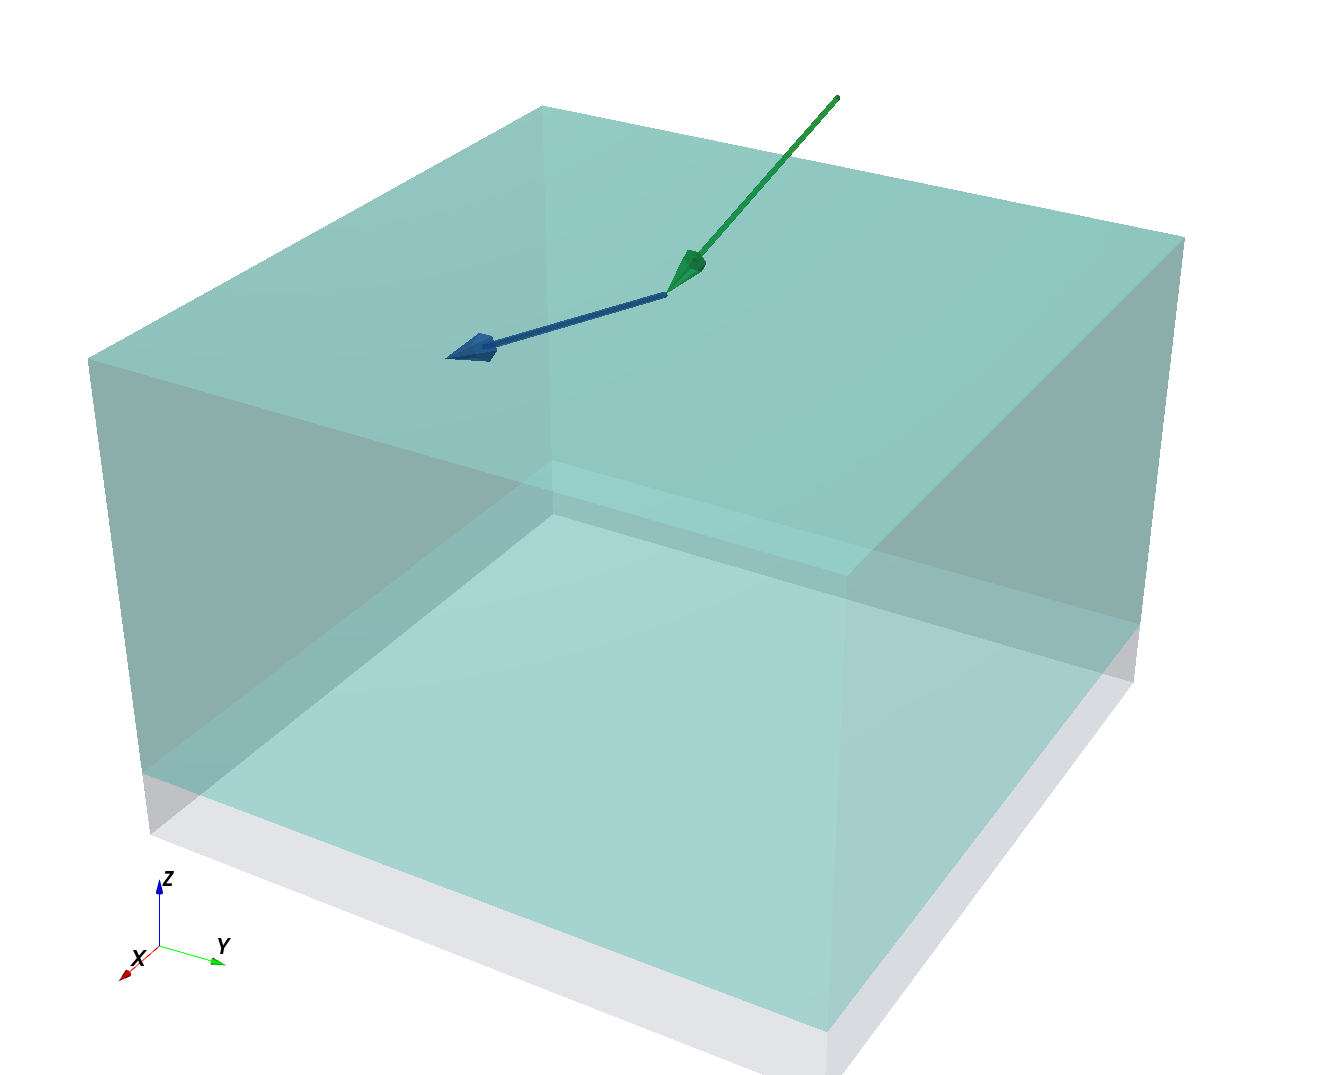
    ba.showSample3D(sample, sample_size=500*nm, seed=0)
    import numpy as np

    # Extract 1D data
    intensity = result.intensities().flatten()
    alpha_axis = result.axis(0)
    alpha_values = np.linspace(alpha_axis.min(), alpha_axis.max(),
                               alpha_axis.size()) / deg

    # Custom plot for intensity vs angle
    ba.plt.figure(figsize=(10, 6))
    ax = ba.plt.gca()
    ax.plot(alpha_values, intensity, 'b-', linewidth=2,
            label=f'z = {z_fixed/nm:.0f} nm')
    ax.axhline(y=1, color='r', linestyle='--', linewidth=1,
               label='Expected vacuum intensity')

    # Calculate and mark critical angle
    delta = 1e-5
    theta_c = np.sqrt(2*delta) * 180/np.pi  # in degrees
    ax.axvline(x=theta_c, color='orange', linestyle=':', linewidth=1.5,
               label=f'Critical angle θc = {theta_c:.3f}°')

    ax.set_xlabel('Incident angle αi (°)', fontsize=14)
    ax.set_ylabel('Intensity', fontsize=14)
    title = f'Intensity vs Angle at z = {z_fixed/nm:.0f} nm (upper boundary)'
    ax.set_title(title, fontsize=16)
    ax.grid(True, alpha=0.3)
    ax.legend(fontsize=10)
    ax.set_ylim([0, max(intensity)*1.1])

    ba.plt.tight_layout()
    ba.plt.show()
|