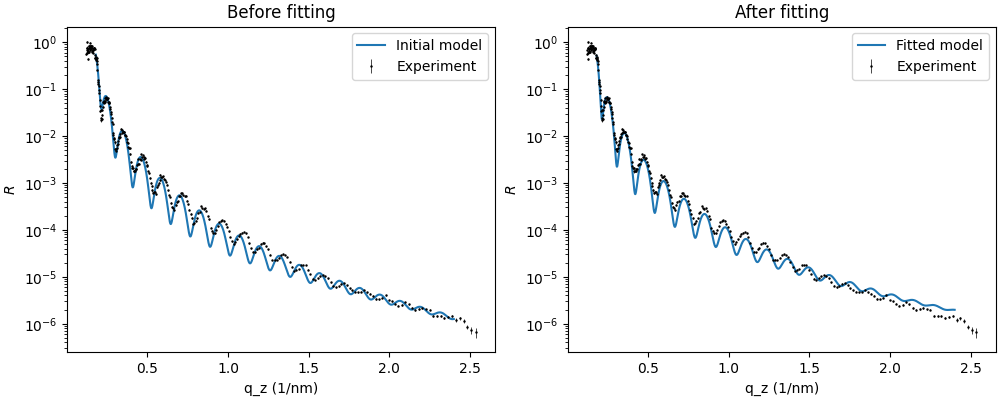
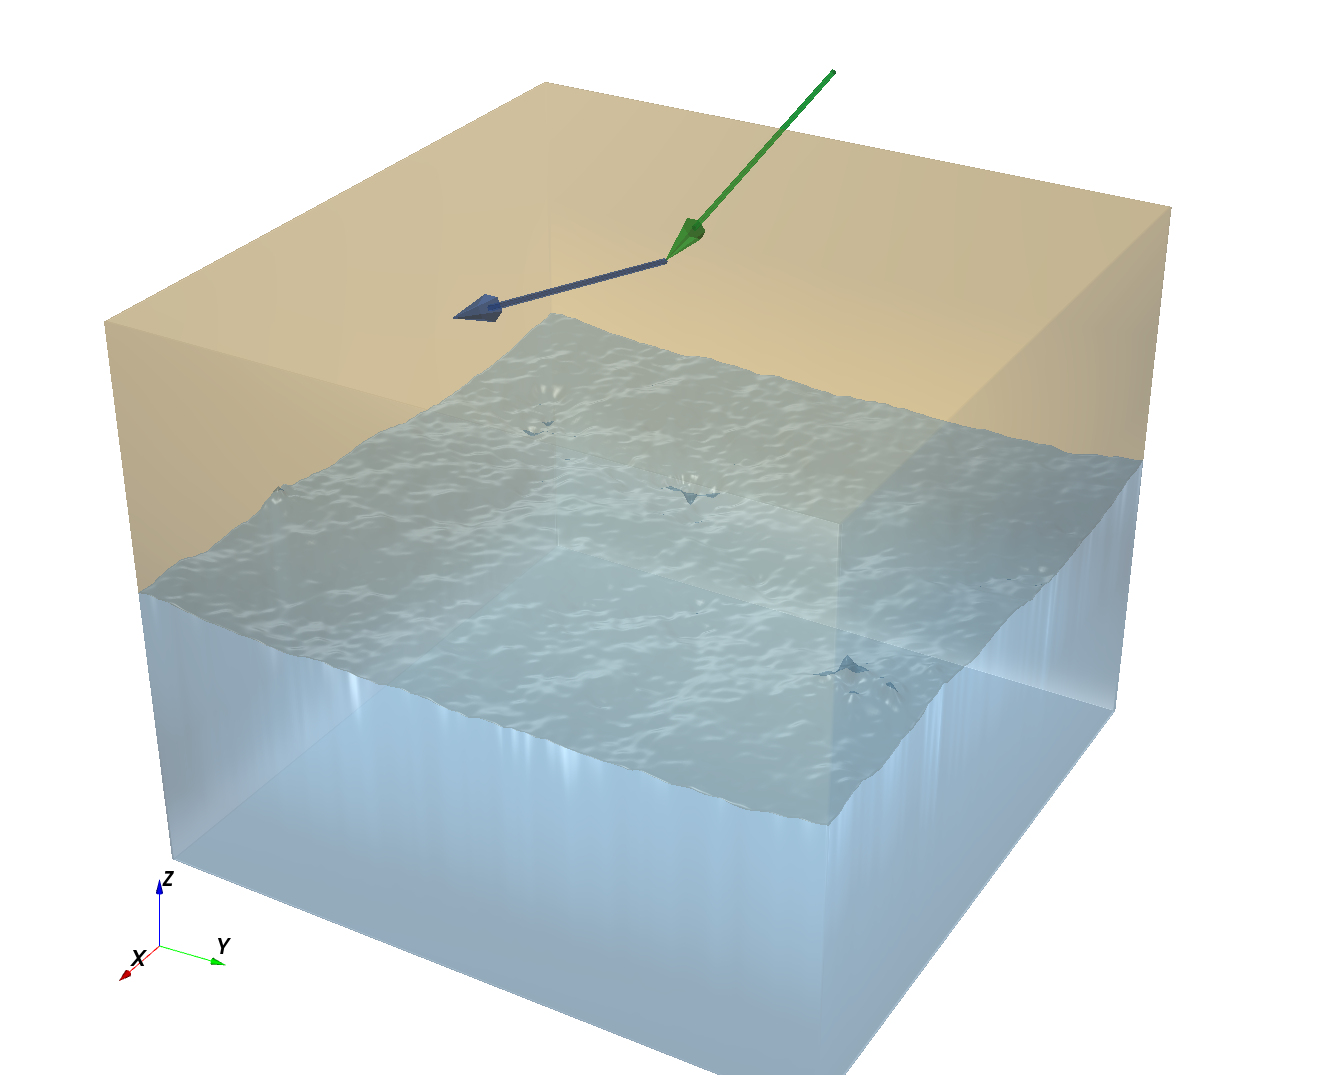
1
  2
  3
  4
  5
  6
  7
  8
  9
 10
 11
 12
 13
 14
 15
 16
 17
 18
 19
 20
 21
 22
 23
 24
 25
 26
 27
 28
 29
 30
 31
 32
 33
 34
 35
 36
 37
 38
 39
 40
 41
 42
 43
 44
 45
 46
 47
 48
 49
 50
 51
 52
 53
 54
 55
 56
 57
 58
 59
 60
 61
 62
 63
 64
 65
 66
 67
 68
 69
 70
 71
 72
 73
 74
 75
 76
 77
 78
 79
 80
 81
 82
 83
 84
 85
 86
 87
 88
 89
 90
 91
 92
 93
 94
 95
 96
 97
 98
 99
100
101
102
103
104
105
106
107
108
109
110
111
112
113
114
115
116
117
118
119
120
121
122
123
124
125
126
127
128
129
130
131
132
133
134
135
136
137
138
139
140
141
142
143
144
145
146
147
148
149
150
151
152
153
154
155
156
157
158
159
160
161
162
163
164
165
166
167
168
169
170
171
172
173
174
175
176
177
178
179
180
|
#!/usr/bin/env python3
# /// script
# requires-python = ">=3.10"
# dependencies = ["bornagain>=25,<26", "lmfit"]
# ///
"""
Fit example with data by M. Fitzsimmons et al,
https://doi.org/10.5281/zenodo.4072376.
Sample is a ~50 nm Pt film on a Si substrate.
Single event data from Spallation Neutron Source
Beamline-4A (MagRef) with 60 Hz pulses and a wavelength
band of roughly 4-7 Å in 100 steps of 2theta.
"""

import bornagain as ba
ba.require_versions("bornagain>=25,<26")
from pathlib import Path
import numpy as np
from bornagain import nm
import lmfit

####################################################################
#  Sample and simulation model
####################################################################

# Use fixed values for the SLD of the substrate and Pt layer
sldPt = (6.3568e-06, 1.8967e-09)
sldSi = (2.0728e-06, 2.3747e-11)

def get_sample(P):

    layer_color = (0.93, 0.72, 0.25)
    layer_mat = ba.SLDMaterial("Pt", layer_color, *sldPt)
    substrate_color = (0.30, 0.62, 0.86)
    substrate_mat = ba.SLDMaterial("Si", substrate_color, *sldSi)

    transient = ba.TanhTransient()

    si_autocorr = ba.SelfAffineFractalModel(P["r_si"]*nm, 0.7, 25*nm)
    pt_autocorr = ba.SelfAffineFractalModel(P["r_pt"]*nm, 0.7, 25*nm)

    r_si = ba.Roughness(si_autocorr, transient)
    r_pt = ba.Roughness(pt_autocorr, transient)

    ambient_layer = ba.Layer(ba.Vacuum())
    layer = ba.Layer(layer_mat, P["t_pt"]*nm, r_pt)
    substrate_layer = ba.Layer(substrate_mat, r_si)

    sample = ba.Sample()
    sample.addLayer(ambient_layer)
    sample.addLayer(layer)
    sample.addLayer(substrate_layer)

    return sample


def get_simulation(q_axis, P):
    sample = get_sample(P)

    scan = ba.QzScan(q_axis)
    scan.setIntensity(P["intensity"])
    scan.setOffset(P["q_offset"])

    distr = ba.DistributionGaussian(0., 1., 25, 4.)
    scan.setAbsoluteQResolution(distr, P["q_resolution"])

    simulation = ba.SpecularSimulation(scan, sample)

    return simulation


def load_data(filename):
    """
    Reads q, reflectivity, and its uncertainty.

    The unused fourth column is the width of a logarithmic q bin, not a
    Gaussian instrument resolution.
    """
    # Data files are next to this script.
    data_dir = Path(__file__).resolve().parent
    filepath = data_dir / filename
    q_angstrom, intensity, sigma = ba.read_columns(
        filepath, usecols=(0, 1, 2))
    q = 10*q_angstrom
    return q, intensity, sigma

####################################################################
#  Main
####################################################################

if __name__ == '__main__':

    P = lmfit.Parameters()

    P.add("intensity", value=1, min=0.8, max=1.2)  # (dimensionless)
    P.add("q_offset", value=0.01, min=-0.02, max=0.02)  # (1/nm)
    P.add("q_resolution", value=0.01, min=0, max=0.02)  # (1/nm)
    P.add("t_pt", value=50, min=45, max=55)  # (nm)
    P.add("r_si", value=1.22, min=0, max=5)  # (nm)
    P.add("r_pt", value=0.25, min=0, max=5)  # (nm)
    initialP = P.valuesdict()

    # Set q axis, load data:

    qmin = 0.18
    qmax = 2.4
    qzs = np.linspace(qmin, qmax, 1500)

    q_exp, exp_values, sigma = load_data("RvsQ_36563_36662.dat.gz")
    exp_data = ba.Datafield(
        ba.Frame(ba.ListScan("q_z (1/nm)", q_exp)),
        exp_values.tolist(), sigma.tolist())

    initial_result = get_simulation(qzs, initialP).simulate()

    # Restrict data to given q range

    in_range = (q_exp >= qmin) & (q_exp <= qmax)
    q_fit = q_exp[in_range]
    y_fit = exp_values[in_range]

    # Fit:

    def residuals(P):
        sim_values = get_simulation(
            q_fit, P.valuesdict()).simulate().intensities()
        return y_fit - sim_values

    result = lmfit.minimize(residuals, P, method="leastsq")

    print(lmfit.fit_report(result))

    finalP = result.params.valuesdict()

    # Print and plot fit outcome:

    print("Fit Result:")
    print(finalP)
    ba.showSample3D(get_sample(finalP), sample_size=120*nm, seed=0)

    fitted_result = get_simulation(qzs, finalP).simulate()

    figure, (initial_ax, fitted_ax) = ba.plt.subplots(
        1, 2, figsize=(10, 4), layout="constrained")
    ba.plot_multicurve(
        [None],
        measured=[exp_data],
        labels=["Experiment"],
        ax=initial_ax,
        ylabel="$R$",
        pointargs={'color': 'black'},
    )
    ba.plot_multicurve(
        [initial_result],
        measured=[None],
        labels=["Initial model"],
        ax=initial_ax,
        ylabel="$R$",
    )
    initial_ax.set_title("Before fitting")
    initial_ax.legend()

    ba.plot_multicurve(
        [None],
        measured=[exp_data],
        labels=["Experiment"],
        ax=fitted_ax,
        ylabel="$R$",
        pointargs={'color': 'black'},
    )
    ba.plot_multicurve(
        [fitted_result],
        measured=[None],
        labels=["Fitted model"],
        ax=fitted_ax,
        ylabel="$R$",
    )
    fitted_ax.set_title("After fitting")
    fitted_ax.legend()
    ba.plt.show()
|