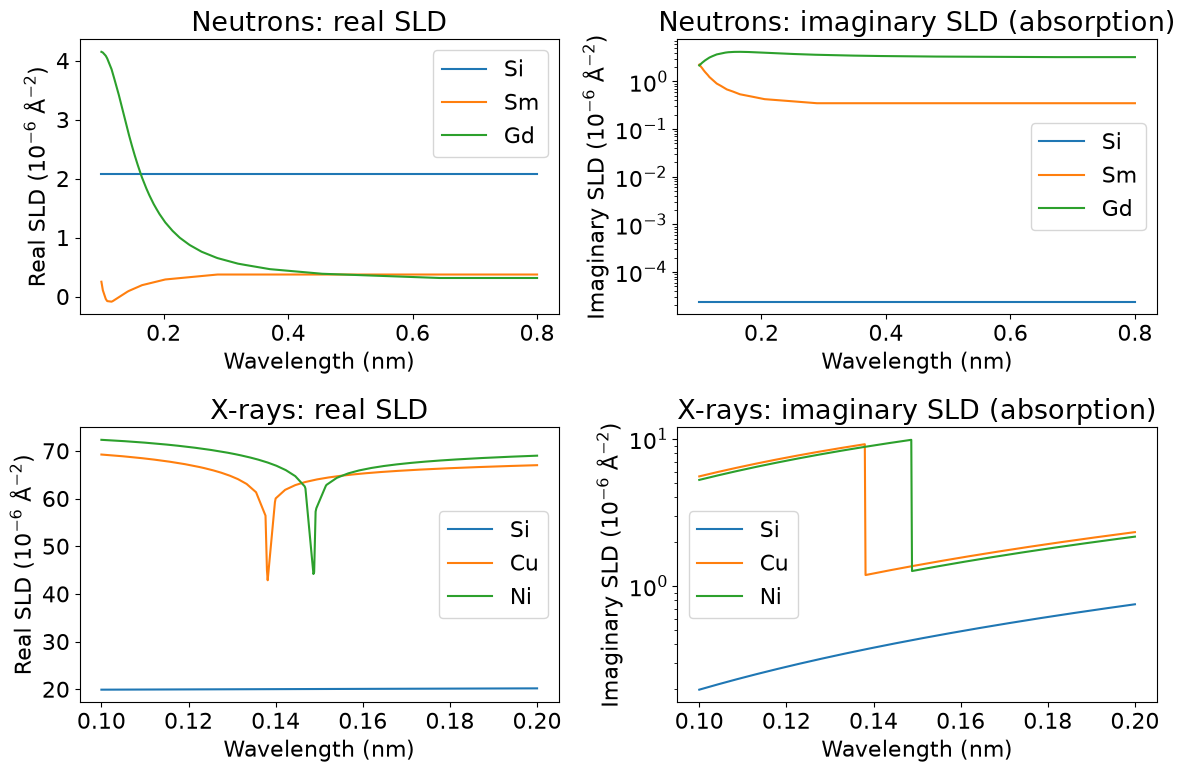
1
 2
 3
 4
 5
 6
 7
 8
 9
10
11
12
13
14
15
16
17
18
19
20
21
22
23
24
25
26
27
28
29
30
31
32
33
34
35
36
37
38
39
40
41
42
43
44
45
46
47
48
49
50
51
52
53
54
55
56
57
58
59
60
61
62
63
64
65
66
67
68
69
70
71
72
73
74
75
76
77
|
#!/usr/bin/env python3
# /// script
# requires-python = ">=3.10"
# dependencies = ["bornagain>=25,<26", "periodictable"]
# ///
"""
Compare neutron and X-ray material spectra from periodictable.
"""

import bornagain as ba
ba.require_versions("bornagain>=25,<26")
import numpy as np
import periodictable
from bornagain import angstrom, nm


def neutron_table(formula, density, wavelengths):
    # periodictable uses angstroms and returns SLD in 10^-6 A^-2.
    rows = []
    for wavelength in wavelengths:
        real, absorption, incoherent = periodictable.neutron_sld(
            formula, density=density, wavelength=wavelength/angstrom)
        rows.append((wavelength, real*1e-6, absorption*1e-6))
    return np.array(rows)


def xray_table(formula, density, wavelengths):
    # The X-ray function uses the same units as the neutron function.
    rows = []
    for wavelength in wavelengths:
        real, absorption = periodictable.xray_sld(
            formula, density=density, wavelength=wavelength/angstrom)
        rows.append((wavelength, real*1e-6, absorption*1e-6))
    return np.array(rows)


def plot_spectra(title, definitions, wavelengths, table_function, row):
    real_plot = ba.plt.subplot(2, 2, 2*row - 1)
    absorption_plot = ba.plt.subplot(2, 2, 2*row)
    for formula, density in definitions:
        curve = table_function(formula, density, wavelengths)
        curve_real = curve[:, 1]
        curve_absorption = curve[:, 2]

        real_plot.plot(wavelengths, curve_real*1e6, label=formula)
        absorption_plot.plot(wavelengths, curve_absorption*1e6,
                             label=formula)

    real_plot.set_ylabel(r"Real SLD ($10^{-6}$ Å$^{-2}$)")
    absorption_plot.set_ylabel(r"Imaginary SLD ($10^{-6}$ Å$^{-2}$)")
    absorption_plot.set_yscale("log")
    for plot in (real_plot, absorption_plot):
        plot.set_xlabel("Wavelength (nm)")
        plot.legend()
    real_plot.set_title(f"{title}: real SLD")
    absorption_plot.set_title(f"{title}: imaginary SLD (absorption)")


if __name__ == "__main__":
    # Formula and density in g/cm^3.
    neutron_definitions = [("Si", 2.33), ("Sm", 7.52), ("Gd", 7.9)]
    xray_definitions = [("Si", 2.33), ("Cu", 8.96), ("Ni", 8.9)]

    ba.plt.rcParams["font.size"] = 16
    ba.plt.figure(figsize=(12, 8))

    neutron_wavelengths = np.linspace(0.1*nm, 0.8*nm, 301)
    plot_spectra("Neutrons", neutron_definitions,
                 neutron_wavelengths, neutron_table, row=1)

    xray_wavelengths = np.linspace(0.1*nm, 0.2*nm, 601)
    plot_spectra("X-rays", xray_definitions,
                 xray_wavelengths, xray_table, row=2)

    ba.plt.tight_layout()

    ba.plt.show()
|