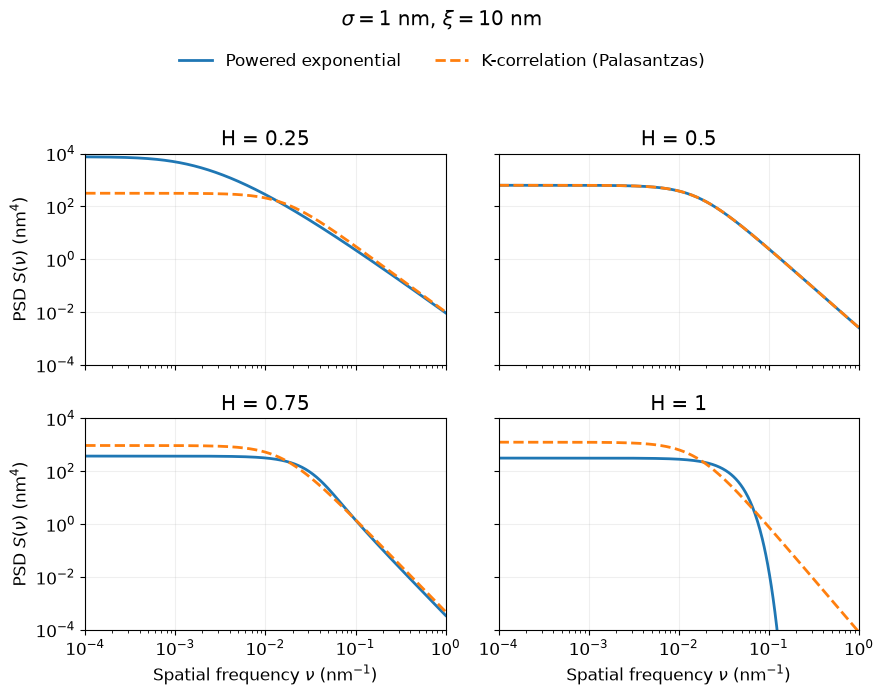
1
 2
 3
 4
 5
 6
 7
 8
 9
10
11
12
13
14
15
16
17
18
19
20
21
22
23
24
25
26
27
28
29
30
31
32
33
34
35
36
37
38
39
40
41
42
43
44
45
46
47
48
49
50
51
52
53
54
55
56
57
58
59
60
61
|
#!/usr/bin/env python3
# /// script
# requires-python = ">=3.10"
# dependencies = ["bornagain>=25,<26"]
# ///
"""
Compare the roughness spectra of the K-correlation (SelfAffineFractalModel)
and powered-exponential (PoweredExponentialModel) covariance models.
"""

import bornagain as ba
ba.require_versions("bornagain>=25,<26")
from bornagain import nm
import numpy as np

SIGMA = 1*nm
CORRELATION_LENGTH = 10*nm
HURST_VALUES = [0.25, 0.5, 0.75, 1]


def spectrum(model, frequencies):
    return np.array([model.spectralFunction(f) for f in frequencies])


def models(hurst):
    return (ba.PoweredExponentialModel(SIGMA, hurst, CORRELATION_LENGTH,
                                      float('inf')),
            ba.SelfAffineFractalModel(SIGMA, hurst, CORRELATION_LENGTH,
                                      float('inf')))


if __name__ == '__main__':
    frequencies = np.geomspace(1e-4, 1, 601)/nm

    ba.plt.rcParams['font.size'] = 12
    fig, plots = ba.plt.subplots(2, 2, figsize=(9, 7), sharex=True,
                                 sharey=True)
    for plot, hurst in zip(plots.flat, HURST_VALUES):
        powered, k_correlation = models(hurst)
        plot.loglog(frequencies, spectrum(powered, frequencies),
                     color='tab:blue', linewidth=2,
                     label='Powered exponential')
        plot.loglog(frequencies, spectrum(k_correlation, frequencies), '--',
                     color='tab:orange', linewidth=2,
                     label='K-correlation (Palasantzas)')
        plot.set_title(f'H = {hurst}')
        plot.set_xlim(1e-4, 1)
        plot.set_ylim(1e-4, 1e4)
        plot.grid(which='major', alpha=0.2)

    for plot in plots[-1]:
        plot.set_xlabel(r'Spatial frequency $\nu$ (nm$^{-1}$)')
    for plot in plots[:, 0]:
        plot.set_ylabel(r'PSD $S(\nu)$ (nm$^4$)')
    fig.suptitle(r'$\sigma = 1$ nm, $\xi = 10$ nm', y=0.99)
    handles, labels = plots[0, 0].get_legend_handles_labels()
    fig.legend(handles, labels, loc='upper center', ncol=2,
                bbox_to_anchor=(0.5, 0.95), frameon=False)
    fig.tight_layout(rect=(0, 0, 1, 0.90))

    ba.plt.show()
|