1
  2
  3
  4
  5
  6
  7
  8
  9
 10
 11
 12
 13
 14
 15
 16
 17
 18
 19
 20
 21
 22
 23
 24
 25
 26
 27
 28
 29
 30
 31
 32
 33
 34
 35
 36
 37
 38
 39
 40
 41
 42
 43
 44
 45
 46
 47
 48
 49
 50
 51
 52
 53
 54
 55
 56
 57
 58
 59
 60
 61
 62
 63
 64
 65
 66
 67
 68
 69
 70
 71
 72
 73
 74
 75
 76
 77
 78
 79
 80
 81
 82
 83
 84
 85
 86
 87
 88
 89
 90
 91
 92
 93
 94
 95
 96
 97
 98
 99
100
101
102
103
104
105
106
107
108
109
110
111
112
113
114
115
116
117
118
119
120
121
122
123
|
#!/usr/bin/env python3
# /// script
# requires-python = ">=3.10"
# dependencies = ["bornagain>=25,<26"]
# ///
"""
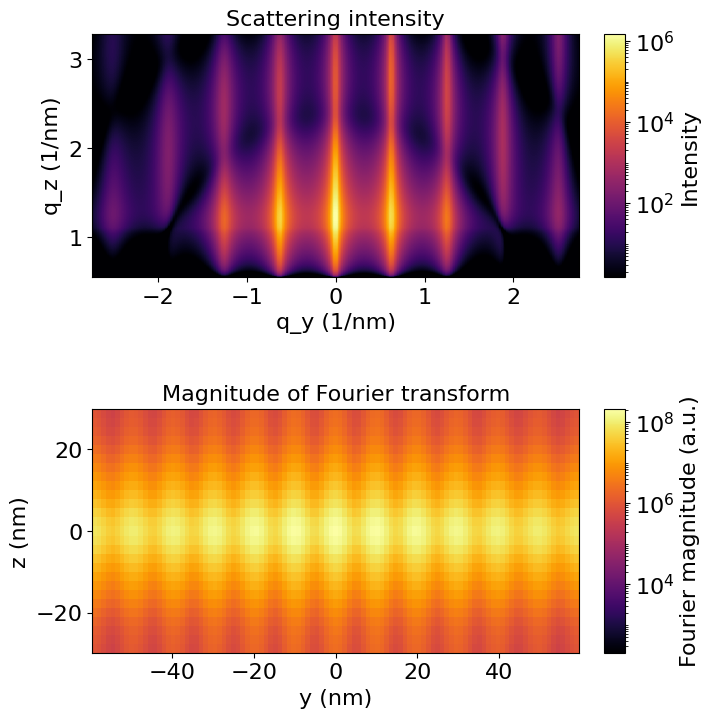
Fourier transform of a simulated 2D scattering pattern.
"""
import bornagain as ba
ba.require_versions("bornagain>=25,<26")
from bornagain import deg, nm
import numpy as np


wavelength = 0.04*nm
alpha = 0.2*deg
lattice_period = 10*nm


def get_sample():
    """
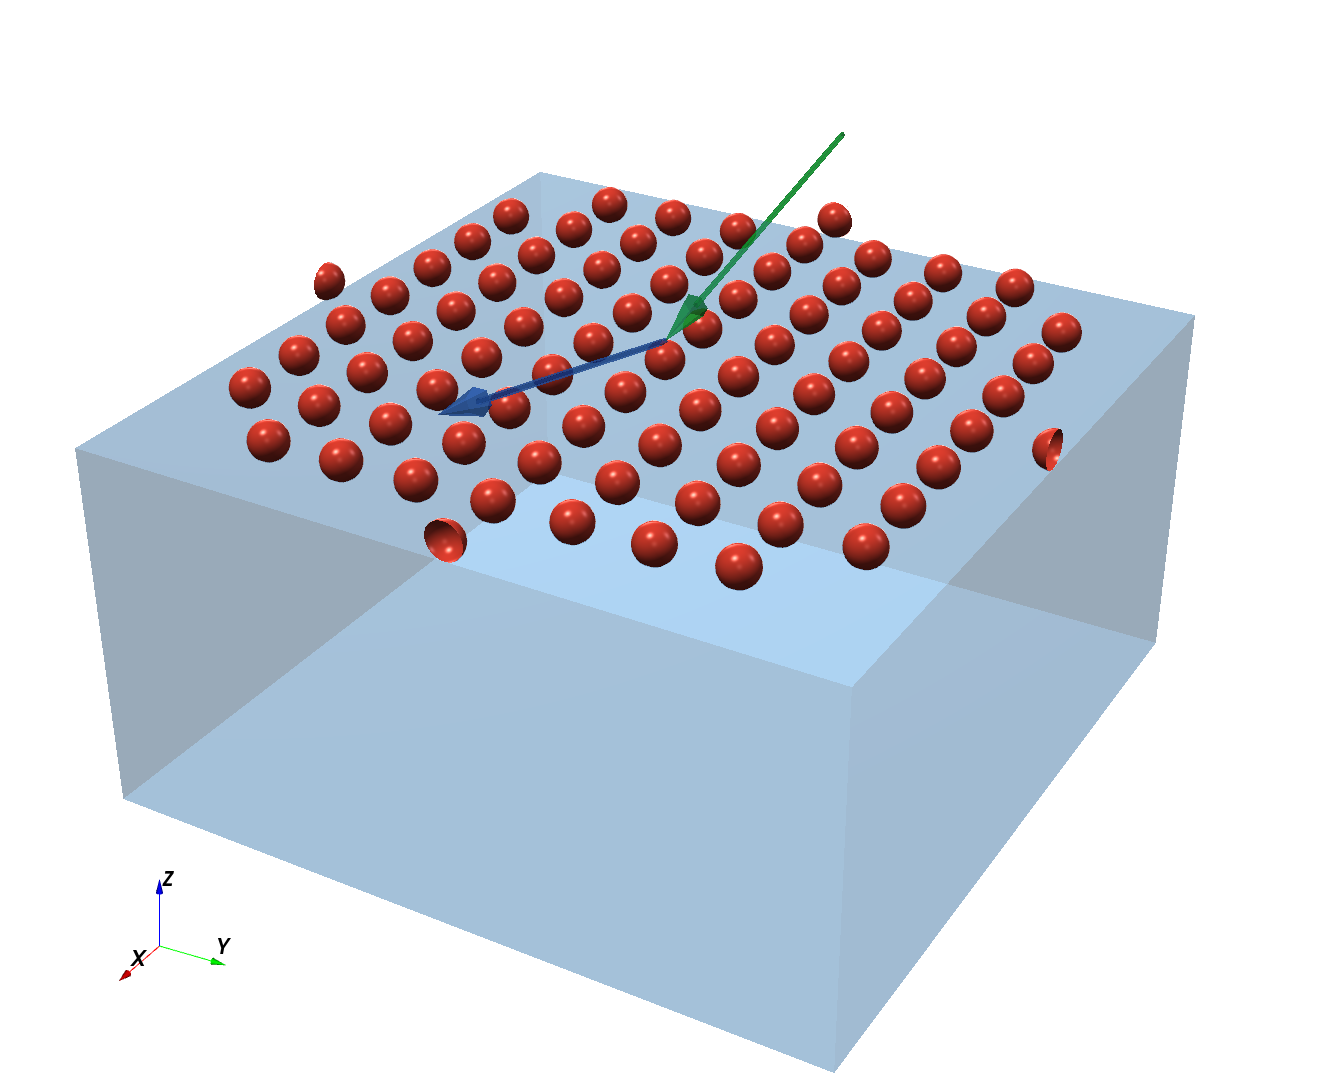
    Creates spheres on a square lattice.
    """
    # Materials
    red = (0.86, 0.24, 0.18)
    particle_material = ba.RefractiveMaterial("Particle", red, 6e-5, 2e-8)
    blue = (0.28, 0.57, 0.82)
    substrate = ba.RefractiveMaterial("Substrate", blue, 6e-6, 2e-8)

    # Particle arrangement
    particle = ba.Particle(particle_material, ba.Sphere(2.5*nm))
    lattice = ba.SquareLattice2D(lattice_period, 2*deg)
    layout = ba.Crystal2D(particle, lattice)
    layout.setDecayFunction(ba.Profile2DCauchy(50*nm, 50*nm, 0))

    # Layers
    vacuum_layer = ba.Layer(ba.Vacuum())
    vacuum_layer.deposit2D(layout)
    substrate_layer = ba.Layer(substrate)

    # Sample
    sample = ba.Sample()
    sample.addLayer(vacuum_layer)
    sample.addLayer(substrate_layer)
    return sample


def get_simulation(sample):
    """
    Creates a GISAS simulation with a two-dimensional detector.
    """
    beam = ba.Beam(1e9, wavelength, alpha)
    n = 200
    detector = ba.SphericalDetector(n, -1*deg, 1*deg, n, 0, 1*deg)
    return ba.ScatteringSimulation(beam, sample, detector)


def fourier_transform(q_result):
    """
    Transforms an equidistant q_y/q_z Datafield to real-space axes.
    """
    # Intensity and reciprocal-space bin widths
    intensity_values = q_result.intensities()
    q_y_step = np.diff(q_result.xCenters()).mean()
    q_z_step = np.diff(q_result.yCenters()).mean()

    # Fourier magnitude centered at zero frequency
    fourier_values = np.fft.fft2(intensity_values)
    centered_fourier_values = np.fft.fftshift(fourier_values)
    fourier_magnitude = np.abs(centered_fourier_values)

    # Conjugate real-space coordinates
    y_frequencies = np.fft.fftfreq(intensity_values.shape[1], d=q_y_step)
    z_frequencies = np.fft.fftfreq(intensity_values.shape[0], d=q_z_step)
    y_coordinates = 2*np.pi*np.fft.fftshift(y_frequencies)
    z_coordinates = 2*np.pi*np.fft.fftshift(z_frequencies)

    # Real-space Datafield
    real_space_frame = ba.Frame(
        ba.ListScan("y (nm)", y_coordinates.tolist()),
        ba.ListScan("z (nm)", z_coordinates.tolist()))
    flat_magnitude = fourier_magnitude.ravel().tolist()
    return ba.Datafield(real_space_frame, flat_magnitude)


if __name__ == '__main__':
    # Simulate intensity on angular detector axes
    sample = get_sample()
    angular_result = get_simulation(sample).simulate()

    # Convert the detector axes to reciprocal-space coordinates
    transformation = ba.FrameTrafo.ScatteringToQ(wavelength, alpha)
    q_result = transformation.transformedDatafield(angular_result)

    # Transform the intensity map to real-space coordinates
    fourier_result = fourier_transform(q_result)
    ba.showSample3D(sample, sample_size=100*nm, seed=0)

    # Crop only the displayed result
    y_min = -6*lattice_period
    y_max = 6*lattice_period
    z_min = -3*lattice_period
    z_max = 3*lattice_period
    fourier_crop = fourier_result.crop(y_min, z_min, y_max, z_max)

    # Plot reciprocal-space intensity and its Fourier magnitude
    figure = ba.plt.figure(figsize=(7, 7.5), layout="constrained")
    plot_axes = figure.subplots(2, 1)
    ba.plot_heatmap(
        q_result,
        ax=plot_axes[0],
        with_cb=True,
        unit_aspect=1,
        title="Scattering intensity",
        zlabel="Intensity")
    ba.plot_heatmap(
        fourier_crop,
        ax=plot_axes[1],
        with_cb=True,
        unit_aspect=1,
        title="Magnitude of Fourier transform",
        zlabel="Fourier magnitude (a.u.)")
    ba.plt.show()
|
 BornAgain
≻ git-develop
≻ Documentation ≻ Examples ≻ GISAS ≻ Methods and analysis ≻ Fourier transform
BornAgain
≻ git-develop
≻ Documentation ≻ Examples ≻ GISAS ≻ Methods and analysis ≻ Fourier transform