1
 2
 3
 4
 5
 6
 7
 8
 9
10
11
12
13
14
15
16
17
18
19
20
21
22
23
24
25
26
27
28
29
30
31
32
33
34
35
36
37
38
39
40
41
42
43
44
45
46
47
48
49
50
51
52
53
54
55
56
57
58
59
60
61
62
63
64
65
66
67
68
69
70
71
72
73
74
|
#!/usr/bin/env python3
# /// script
# requires-python = ">=3.10"
# dependencies = ["bornagain>=25,<26"]
# ///
"""
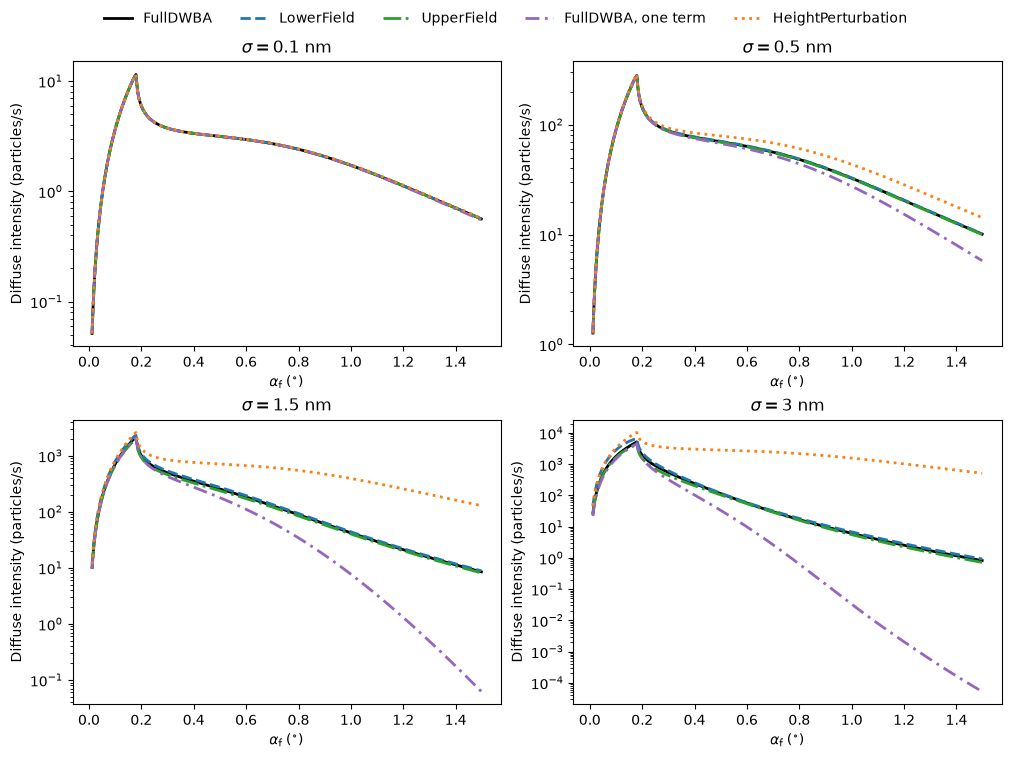
Compare diffuse roughness approximations at several RMS heights.

Each panel uses the same uncut exponential height covariance and detector.
All curves use sharp reference waves; the field treatment differs.
"""

import bornagain as ba
ba.require_versions("bornagain>=25,<26")
from bornagain import deg, nm

WAVELENGTH = 0.1*nm
ALPHA_I = 0.3*deg
CORRELATION_LENGTH = 100*nm
RMS_HEIGHTS = [0.1*nm, 0.5*nm, 1.5*nm, 3*nm]
MODES = [
    ('FullDWBA', 64, 'FullDWBA', 'black', '-'),
    ('LowerField', 64, 'LowerField', 'tab:blue', '--'),
    ('UpperField', 64, 'UpperField', 'tab:green', '-.'),
    ('FullDWBA', 1, 'FullDWBA, one term', 'tab:purple', (0, (5, 2, 1, 2))),
    ('HeightPerturbation', 1, 'HeightPerturbation', 'tab:orange', ':'),
]


def get_sample(sigma):
    substrate_color = (0.28, 0.57, 0.82)
    substrate = ba.RefractiveMaterial('Substrate', substrate_color, 5e-6,
                                     2e-8)
    model = ba.PoweredExponentialModel(sigma, 0.5, CORRELATION_LENGTH,
                                      float('inf'))
    roughness = ba.Roughness(model, ba.ErfTransient())
    sample = ba.Sample()
    sample.addLayer(ba.Layer(ba.Vacuum()))
    sample.addLayer(ba.Layer(substrate, roughness))
    return sample


def calculate(sample, approximation, terms):
    scan = ba.AlphaScan([ALPHA_I])
    scan.setWavelength(WAVELENGTH)
    scan.setIntensity(1e8)
    detector = ba.OffspecDetector(400, 0.01*deg,
                                 1.5*deg, -0.1*deg, 0.1*deg)
    simulation = ba.OffspecSimulation(scan, sample, detector)
    simulation.options().setDwbaReferenceWaves('Sharp')
    simulation.options().setRoughnessApproximation(approximation, terms)
    return simulation.simulate().flat()


if __name__ == '__main__':
    fig = ba.plt.figure(figsize=(10, 7.5), layout='constrained')
    axes = fig.subplots(2, 2)
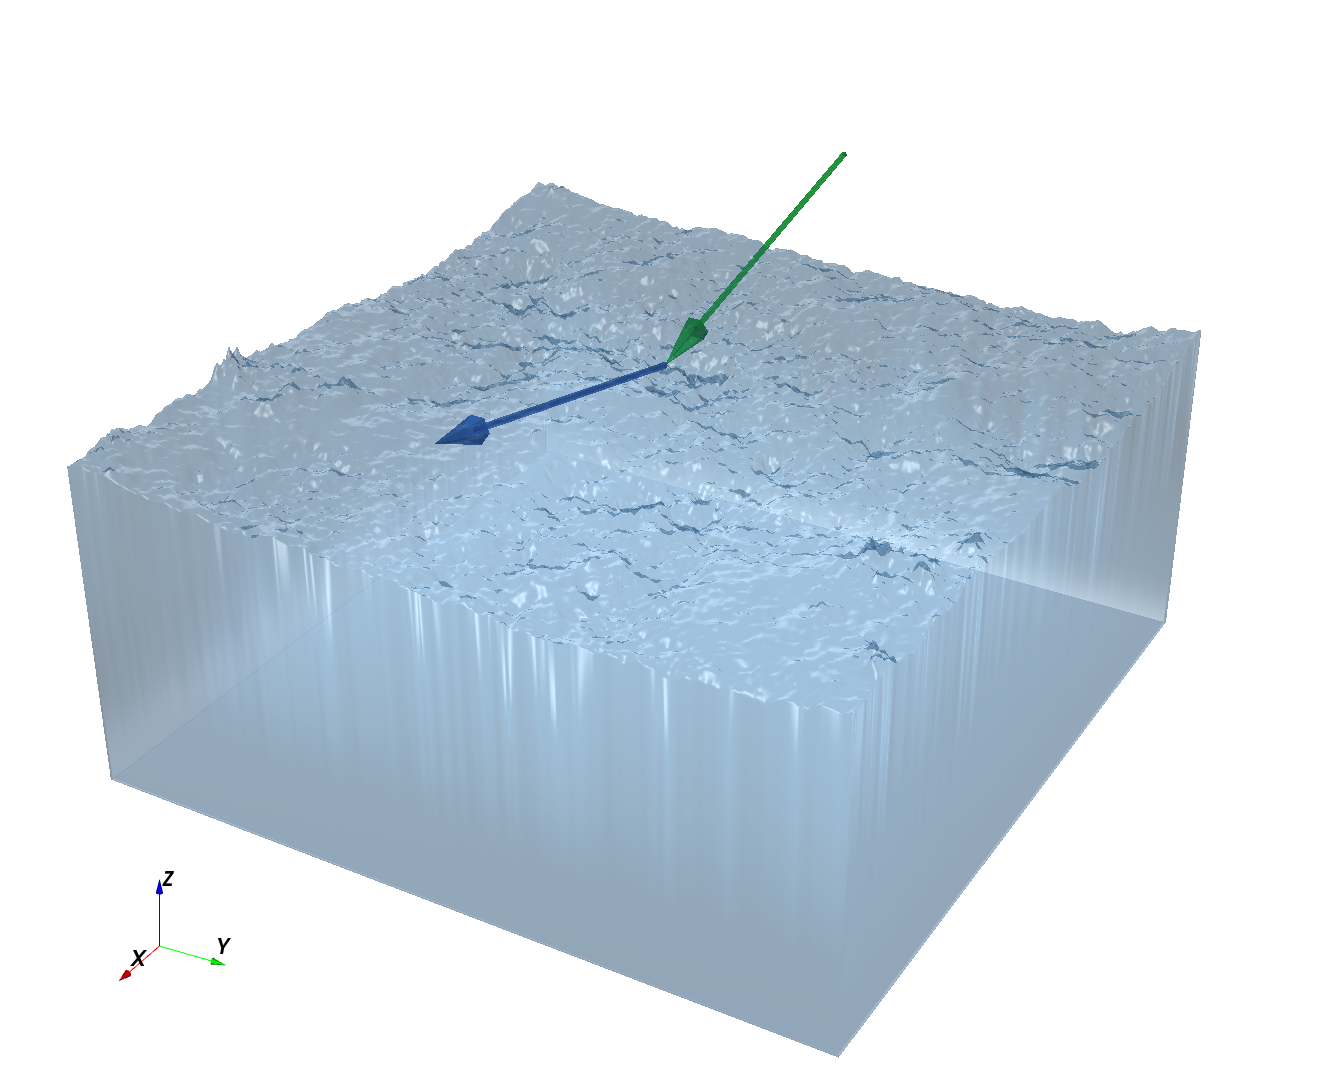
    ba.showSample3D(get_sample(RMS_HEIGHTS[-1]), sample_size=120*nm, seed=0)
    for axis, sigma in zip(axes.flat, RMS_HEIGHTS):
        sample = get_sample(sigma)
        for approximation, terms, label, color, style in MODES:
            lineargs = {'color': color, 'linestyle': style, 'linewidth': 2}
            ba.plot_curve(calculate(sample, approximation, terms),
                          ax=axis,
                          label=label,
                          ylabel='Diffuse intensity (particles/s)',
                          lineargs=lineargs)
        axis.set_title(rf'$\sigma = {sigma/nm:g}$ nm')
    fig.legend(*axes.flat[0].get_legend_handles_labels(),
               loc='outside upper center',
               ncol=5,
               frameon=False)

    ba.plt.show()
|
 BornAgain
≻ git-develop
≻ Documentation ≻ Examples ≻ Off-specular ≻ Roughness approximations vs sigma